Quotes

Look back over the past, with its changing empires that rose and fell, and you can foresee the future too.

— Marcus Aurelius

Followers

Search This Blog

Showing posts with label AAPL. Show all posts

Tuesday, December 31, 2019

AAPL parabolic

Apple - bellwether stock - widely owned by individuals and funds, huge index weighting - so all index-linked funds have to be heavily invested - everyone knows it's a "great" company ;)..so what next?
Below is the quarterly chart, with a parabolic rise laid over the top.  "Parabolic up moves are exciting to ride, but there is the almost certain danger that the rocket will run out of fuel, resulting in a rapid collapse of prices. Trying to pick the final top for this kind of move could be hazardous to one's health, but being aware of the potential danger can be useful in managing positions."


Below the AAPL chart is the weekly silver chart which shows a parabolic move in 2011 and the subsequent collapse.  I'm not saying that the top is in AAPL - but care is needed. 


Thursday, November 15, 2018

Apple succumbs to gravity

Quick look at Apple Inc.

Huge stock for the market due to it's weighting in indices and as a company; a bell-weather for tech stocks.

What does the recent fall do to prospects for the future?
The monthly chart puts it into perspective - a HUGE rally, which is now correcting BIG question is where to?


Looking at the weekly for a closer look
Highlighted areas are horizontal price supports
Close to the first one and the up trend line, (the steeper one).  This is probably good for a short term bounce.


Now zoom in to the daily
A little more to the downside to really test the horizontal support at 180 approximately


Tuesday, March 5, 2013

Finally a break out to the upside imminent

Are the markets poised to break higher..finally?
The consolidation has been longer than expected BUT
the downside has been limited
the weak longs are probably shaken out
the bears have been given some hope

so NOW the market may be ready for new highs

FTSE  4 hr chart
A break above 6426 and holding should mean a new high for the FTSE.
and eventually possible all time high


DAX

Similar to FTSE long consolidation after rally from November.  Again, despite only giving back max 4% the sentiment has been increasingly bearish.
Next hurdle for DAX is 7865


Euro vs USD

All currencies have been weak vs the USD recently. On the Euro daily chart it looks like some positive divergence creeping in.  Euro may be due for a rally, and conversely the dollar due a fall?


AAPL

still not getting any love and hatred increasing. 406 next support after that 380
Yesterday finally filled a gap
Despite AAPL falling NDX has been holding well, if/when AAPL rallies NDX has a bull flag target of 2900


Quick look at NDX


Wednesday, February 13, 2013

Consolidation over?

DAX and FTSE have been consolidating after rally from November lows.  Is the consolidation finished?

It's looking increasingly like it.  Markets have given very little back; bears will be getting nervous, and buyers seem to be pressing.  The next rally could be the end of this run, but with quite a lot of bears around it may run further than expected.

FTSE
Looks like it has respected the channel it is in and bounced off the mid point
rally should head towards upper boundary 6426


DAX

seems to have found support at 7570
above 7726 should accelerate as bears give up
target minimum the highs..7860 though probably higher


NDX Nasdaq 100

After the big gap up traded in range 2700 /2760
very dependent on AAPL 
BUT has broken above that range
expect support 2750.2760
rally should carry eventually to 2890 or higher
Use AAPL weakness to buy dips!!


AAPL

Stiff resistance at 500
probably range bound 440 to 500


DJIA

 high level consolidation
everyone "expecting " correction
so probability is it heads higher..
a break above 14200 may accelerate


Thursday, January 17, 2013

Week 3 ..CONSOLIDATION

January week 3.

Markets have consolidated the recent gains, most notably the DAX, which had a month of up days with little correction.  FTSE flirting with 6100/6070 as support.  EURO broke through 1.33 and looks to be back testing that level, holding above 1.325.  Cable notable under performer clinging to 1.60 level.


S&P very tight range 1465/1473

Oil, gold and silver have also held their rallies, as copper consolidates

OPEX week so not expecting major change this week. 

AAPL trading dominated by emotions.  $500 key PSYCHOLOGICAL level was broken mid week, and subsequently recovered.  The POSITIVE divergence on the DAILY chart continues and it is possible that the drop below $500 has now cleared out weak hands and "emotional " selling.  AAPL has also caused to NDX to under perform so a turnaround should be reflected many times in the NDX


CHARTS

FTSE Daily

May still be a move down but would not expect 6000 to be reached, more likely 6050 if anything
More likely scenario is a break higher once this consolidation is finished with.  Targeting 6400


DAX daily

DAX also consolidating (pink box) after the strong rally from November low.(light blue arrow)
Also looks like it will be on the way to new highs once this is over.
Possible for a scary move down MAX 7560 (in the scheme of things not that big a fall, but would shake out any weak hands).  More likely we have seen the extent of this consolidation, and a break above 7800 , targets 8000 and maybe higher. 


EURO daily

The EURUSD looks to be headed higher 1.35 first target.  Projected path pull back and then rally further towards 1.40 level, which SHOULD coincide with new highs in equities and a push higher in commodities.


Cable daily chart

1.60 looked to be key level..but like AAPL probably more psychological with a lot of stops just below. More important should be 1,5970
tentative EW labeling ! Maybe we are poised for wave iii up. Target 1.63 and beyond

A drop below 1.5830 changes things


AAPL daily


NDX daily chart

The GAP up has not been filled (BULLISH)
looks to be forming BULL flag between 2710 and 2750
A sustained break above 2750 could target 2890 (measured move)


NDX weekly chart

Chart is pretty self explanatory
a sustained break above the rectangle  and we could see similar move to August 2012


Tuesday, January 15, 2013

EURUSD top? AAPL bottom?

Euro has rallied off the 1,30 level quickly.

Is this it?

I don't think so..
1.33 was tested 3 times and pushed the rally back..NOW we are above that level, so we should now have support at 1.33 or close by.

How far can it go?

On the daily looks like 1.35 is reasonable short term target before a pullback

EURUSD daily


EURUSD weekly

On the weekly there is one rally followed by corrective action (Bull flag) no broken out and target could be as high as 1.40


AAPL daily chart

Still showing signs of positive divergence with price and RSI
Right angle triangle 
500 support (psychological level)
May get broken just because so many are watching that level.. a break may clear out the last weak hands and then rally, or it may start a new leg down..BUT it seems the NEGATIVE NEWS may already be priced in with the fall from 700.
click on links to see the stories
Sentiment wise everyone is negative, and yesterday front page of Market watch was FULL of bearish stories on AAPL, from cutting production to new competition from Linux based phones.  One positive story stating AAPL is cheap at 500 USD


Tuesday, December 18, 2012

APPLE

AAPL

Daily chart, seems to be setting up POSITIVE divergence (price makes new low, but RSI does not).

Sentiment: seems nobody likes AAPL at 500 !! Yet at 700 EVERYONE wants to BUY.

Some sayings which could be applied to AAPL now.

BUY in the red , SELL in the blue, ie Buy when others are selling and sell when others are buying.

Warren Buffet " Be fearful when others are greedy, Be GREEDY when others are fearful"


Tuesday, December 11, 2012

Buy or sell? DAX, FTSE. DOW, NDX

Follow up on previous post  with FTSE DOW and NDX thrown in for good measure
Long? tighten stops
Short? stops are close by, and be ready to reverse on confirmed break higher...

Markets are poised for a break out higher..but will it be after another shake out??
Where's the crystal ball?

Monthly charts for LONG term investors

DAX

OK ! We may be about to break resistance and head to the highs around 8,000 BUT each time we have entered the highlighted area there has been a severe setback for the DOW.  Will history repeat itself ? (or at least rhyme?)


FTSE

Also approaching a resistance band may be quite tough getting through. If it does, then can probability increases for a min test of the highs at 7,000


DOW

Clear up trend.   A break above recent highs should see test of all time high at 14k.  


NDX

Monthly shows clear up trend with recent weakness testing support and rallying.  a rally should go to new highs above 3,000.
Very dependent on AAPL

AAPL DAILY chart


Oversold rally from around 505 level.  Another sell off almost testing the lows.  watch for
either a new low and rally, with RSI diverging (ie no new low in RSI)
or a move from here above 558 for signs that bottom is in.


Wednesday, October 17, 2012

Markets at crucial levels

DAX

bumping against resistance, 7440.7480 key levels.  A break above that opens way for much higher prices.
Pluses for the rally scenario
1. For the last 3.5 weeks the market has been consolidating the gains since breaking through key resistance at 7170, no real selling BUT the sentiment at these levels turned decidedly bearish, with many looking for a top.
2. The market is not overbought
3. Daily indicators in process of turning up

Possible that we rally and fail at 7500, that would make for a more bearish case, but we would need to see a break below key levels below 7170.

Likelihood is a rally to test 7500 and then a retrace; BUY the dip (If nimble enough trade the short side but beware of sustained move higher)


FTSE
similar to DAX
First chart shows declining trend line resistance 2007, 2011, 2012 tops
second chart shows daily closer up.


EURUSD
on the weekly chart we may have completed a bull flag, in which case measured target is around 1.40 !


AAPL
major market mover, may have bottomed at 623.  If not possible test lower at 600 or at the 200 dma currently 580


Friday, October 5, 2012

AAPL

Apple daily chart

Is everybody getting bearish on AAPL?

The chart shows we HAD negative divergence on the new high, but recent price action seems to have alleviated overbought conditions. Support @ 650 which was the previous resistance.  Maybe a head and shoulders? But volume profile doesn't look right for an H&S.

Thursday, March 22, 2012

Where are we?

Well "where are we?"  Well markets are near a TOP (IMHO) but today the equity markets are correcting, as is the fall in the YEN vs various currencies.  To get an idea where we could be, I look at the DAX, and even though ELLIOTT WAVE theory is not a good PREDICTIVE tool, looking back at where we have been can give us clues to WHERE we MAY be going !

so a look at the DAX daily chart


The preferred count is in RED (looks cleaner) which means we are now in a wave 4, and once this is complete we will head up in the last wave 5 to new highs (or equal if a truncated 5th)


If the count in BLACK is correct we should now start a LARGER correction or a change in trend to DOWN.  


looking at AAPL and equity markets it "feels" like we have just finished wave 3's (Wave 3: Wave three is usually the largest and most powerful wave in a trend  The news is now positive and fundamental analysts start to raise earnings estimates. Prices rise quickly, corrections are short-lived and shallow. Anyone looking to "get in on a pullback" will likely miss the boat. As wave three starts, the news is probably still bearish, and most market players remain negative; but by wave three's midpoint, "the crowd" will often join the new bullish trend. )


AAPL


This is classic wave 3 sentiment, prices rising rapidly, those wanting to get in on a pullback miss the boat and have to pay higher prices, analysts all getting bullish...crowd joining in big time!!


Tuesday, March 20, 2012

Almost there?

After the short correction last week, equities have jumped to the upside, and breakouts have occurred in DAX, NDX, and the DOW to name a few.  Notable in it's non participation the FTSE has been a laggard..and may have already completed a TOP..

May need a couple of weeks of distribution...

DAX chart daily


Arrows show possible topping action over next couple of weeks..anything LARGER and may even challenge the all time highs..


AAPL shares have soared and the bullish HYPE is growing which in the end will result in tears for the latecomers to the party.  Momentum s still on the bulls side, but AAPL has gone parabolic and when it ends parabolic moves usually give back a lot of not all of the rise.  For example SILVER..


compare to AAPL now

As with Silver the "analysts" and media extrapolated the recent gains so there was talk of silver going much higher, how silver was indispensable (in industry, health; silver lined fridges, washing machines etc etc).  Compare that to now how Ipads will be needed by everyone.  Problem is no one can see an Ipad alternative..but IT'S OUT THERE !!!


and here's SILVER after the parabolic move topped.


JUST SAYING!!

Tuesday, March 6, 2012

AAPL

Apple looks like it will conform the negative divergence which has been forming..
watch out for sharp correction


Which will take NDX lower as well


Tuesday, February 28, 2012

APPLE falling out of the tree?

APPLE still in the process of forming negative divergences, new highs in PRICE but RSI is struggling. Not a short yet, but could be time for taking some profits to re-enter long after the correction

Correction should be dramatic when it comes..


Thursday, February 23, 2012

Waiting for the exhaustion rally..

Equity markets have been doing relatively little this week..Likely scenario seems to be an upside break out for most markets which will be received with euphoria on mainstream TV (think CNBC!), and will probably signal the start of the correction (markets do not go up in straight line forever).  The charts below show the case for upside break outs, also some warning signs in the tech sector (NDX, AAPL). I give it 70 % probability?

OR we fail to break out and then correct from here. 30 % probability?


FTSE
Finding support at high levels around 5910 after poking above resistance at 5920. If move gains traction then expect move to 6000/6100.


DAX 
struggling near resistance at 6930.  Possible negative divergence setting up on daily chart.  6930/6950 was support level various times during 2011.


Nasdaq 100 


Overbought under-performing this week.  Negative divergence forming.  Also main component AAPL, possible negative divergence.


APPLE

Negative divergence forming price/RSI.  Warning signal.  may get a new high but if unconfirmed by RSI sell off should be imminent.  


DOW INDUSTRIAL


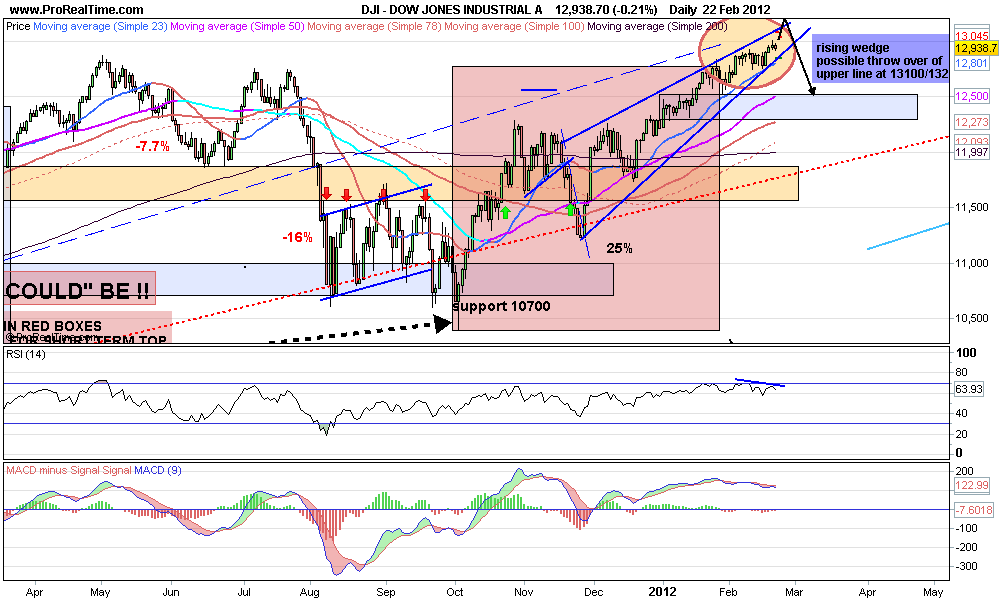
struggling near 13,000 level.  Rising wedge formation (bearish), 13,00o psychological round number, and break out there could see 13100/13200 quickly, before a significant reversal probably targeting 12500


Total Pageviews