Quotes

Look back over the past, with its changing empires that rose and fell, and you can foresee the future too.

— Marcus Aurelius

Followers

Search This Blog

Showing posts with label FTSE. Show all posts

Wednesday, August 14, 2019

FTSE 100


Big fall from 7700 - (looks like many shorts stopped out, and bull trap ) with the subsequent collapse.  Now a corrective rally up to the shaded red area and now turning down.

Likely - new lows coming - but watch RSI - could be setting up for positive divergence and a short to medium-term rally before the next leg down.

ALT:  market keeps going lower and medium-term correction underway.


Thursday, March 28, 2019

short term - battle grounds galore

2 hour charts for DAX, FTSE and NDX 100

Battle in all markets between sellers and buyers
(S&P 2830, 2785 - key levels)

waiting for breaks of up or down for next direction
Or trade the range - but getting smaller so should resolve soon


Tuesday, January 15, 2019

Still waiting for resolution

Bulls are cheering and the talking heads have declared the bear market has ended.  read Jim Cramer article here.

Has it?

Well admittedly the rally has lasted about 12 days...

does that mean a BULL market has started?

look at some charts

DOW daily

So far down trend is still intact
clear classic rising wedge  (usually bearish) shows - more often than not there is a throw over (a rally above the upper boundary) which is quickly retraced


Nasdaq daily

bearish wedge
short term trend is up
but down trend still intact
could target 6750-6800

would need a break above 6880-6900 and follow through to start trend change


DAX and FTSE similar

DAX key upside level 11520
FTSE 7131  - Brexit vote  may have an effect


Sunday, January 6, 2019

Finally - a rally - but is it a trend change?

Finally Friday's action looks like seller stepped back and markets had a decent rally.  Is this a change of trend?  Or just a correction?

Last post looked at the monthly charts, now zooming in to look at the weekly charts.

First the headline index  Dow Jones Industrial
Remember the downtrend on the monthly shows it in perspective - the odds favour a deeper correction.

1.  Bear market rallies are usually very strong rallies
2. The chart shows the down trend within a channel - prices reached the lower boundary - so the market was ripe for a reversal
3.  The action (so far) is still contained within that channel
5. There is still room to the upside to reach the top of the channel.
6 if this is just a short term bear market rally then I would expect prices to turn down again NEAR the top channel
7 A significant break above that channel and we may visit 24236 (see previous post)

May have been premature in discarding the 24236 target
Stopped out of all short positions on Friday - for profits
flat and watching 
expect rally to continue to at least top of channel and possible larger correction in which case 24236 on the cards


What about the other markets? 
DAX weekly

Similar channel
DAX has been showing relative strength vs US markets - has come close to the 10220 target (10275 low)
shaded areas show potential Fibonacci targets for a correction of down trend
Elliott wave - could be starting a wave 4 (up/sideways )  4's can be very difficult to trade - lots of whipsaw


FTSE weekly

Also in a channel
last post highlighted that it was reaching obvious trend line support


Nasdaq 100 weekly

Also in a down trend - but nearer to breaking out
if it does targets next trend line 6750 ish
a turn back down here likely sees new lows


CONCLUSIONS

Markets still in down trends but all rallied near bottom of the channels
May be a sign of short term trend change  to up (6-7 days)
Anything larger may mean bigger upward move
Be nimble and don't get married to short side
Volatility will still be present

Thursday, December 27, 2018

Does the 1000 point rally mean the bottom is in?

So a huge points rally on the first day of trading after Christmas day - is it significant?

1000 points IS a big move - BUT when looked at in PERCENTAGE terms - yesterday's move did NOT even make it in to the top 20 moves since 1900 !

For source click here : Percentage moves of Dow Jones Industrial

Now look at the daily chart:
1. after  a down trend of 16 days it is normal to have a reaction rally
2.  can be 4-7 days long
3. some upside targets 23231, 24284 ( Fibonacci levels)
4. Longer term down trend still intact until 26100 breached

So this kind of move will generate a lot of short covering - so volatility will still be a major feature of the markets.

Pick your moments to go long or re-short


What about other markets?
FTSE daily

No break of down trend


DAX daily
Again no break of down trend


Strategy:
Probably range bound until New Year -
Correction which will alleviate oversold conditions
Once this is done - one more move down the real panic wash out

DAX 10220
FTSE 6300 (BUT may be affected by currency moves)
DOW new target 20k

CAVEAT: Watch the down trend and especially the much higher levels for a change in trend


Wednesday, December 12, 2018

FTSE triangle

Has the FTSE broken out of the triangle to the upside?

Triangles CAN be reversal patterns as well as continuation patterns, however continuation patterns are much more common.

4 hour chart

Shows the longer term support which was broken.
The triangle with potential break (or false break to the upside)

If it's a break to the upside the triangle will be a reversal pattern (rare)
If it's a false break - should reverse fairly soon and retrace the whole move up

Interestingly normally a break below long term support - usually sees a re-test of that support - so this move up may be doing that..

Key is getting back above that support.

Anything less increases the chances that the down move has not finished.


Tuesday, December 11, 2018

FTSE triangle update

Looks like there was a false break out to the upside of the triangle  FTSE traded as high as 6858

That probably stopped out a lot of shorts and sucked in longs playing the break out..

That's what bear market rallies do

All reverse in the afternoon with the DOW giving back all the morning's rally ( again a Trump hot air tweet helping to push it higher)  and more..

Interesting to see the close


FTSE - short term - watch the triangle

The FTSE is an interesting market to watch in terms of technical analysis, especially with the BREXIT "news"

Lots of news  - BUT "news doesn't matter"
 One of the principles of technical analysis whether its normal bar charts or candlesticks is:
"The “what” (price action) is more important than the “why” (news, earnings, and so on)."

Short term the FTSE is forming a symmetrical triangle
This is usually a CONTINUATION pattern i.e. when it completes the preceding trend will re-assert itself  - in this case DOWN
A break above the top boundary will signal that the trend may be changing 

 Caveat:  beware of false break outs both sides; they should happen on increasing volume and usually better to wait for a confirmation with the next bar/candlestick of price action to avoid whip-saw.


Monday, November 25, 2013

No change in UPTREND ..YET.but some warning signs?

DAX

#New all time high !
BUT ..

FTSE seems to be lagging or is it LEADING??  could be froming a bull falg..but surprising with DAX at ATH it hasn't accelerated UP..as yet...

INSIDER selling seems to be picking up over last few weeks..sells about 2 to 3 times more than buys
Data from here  http://j3sg.com/

Gap up open today..maybe  some PANIC buying finally coming in ? Sign of retail feeling left out?

Charts

DAX


FTSE

Bull flag or topping? Weekly chart may give some clues?


FTSE WEEKLY

Not much clue here still looks like 2 possibles bull flag or double top.. a decisive break above would mor elikely mean NEW ATH as well..

How about monthly?


 FTSE MONTHLY

Monthly LOOKS like a top and possibly important one forming, HOWEVER a MONTHLY chart is LONG term.. best to keep it in back of mind...
RSI starting to show some neg divergence..
Previous tops took over 8 months to form..whipsaw and false breaks up and down.


DAX MONTHLY

Thrown in for good measure..
Broken out..
accelerating up..
Only caution is RSI starting to enter overbought, but would suggest at moment no change in trend.


Thursday, October 10, 2013

Update DAX, FTSE

Still twitchy markets, hanging on political situation in USA

DAX daily

Despite all the political turmoil in the USA, the DAX has been very resilient and the down move least pronounced of the European markets.
It seems to suggest that actually the recent down trend is just a correction, and once the political scene in the USA is resolved (which it more likely will be), markets will attempt new highs.  QE likely to continue.


FTSE daily

The FTSE has corrected more sharply than the DAX and has nit made all time highs yet, possibly due to strength of the pound in recent weeks, plus a hit on retail sector, and mining.  QExpecting that more liquidity around the world will eventually raise inflation expectations and tangible assets will rally.


Wednesday, August 28, 2013

Monthly perspectives FTSE, DAX, S&P, DOW

A look at the monthly charts for major indices, LONG TERM.  Looking toppy ..but as they are longer term, may take a month or so to play out.  UNLESS they break significantly higher then odds are that the next BIG move is down, whether it be correction or END of this BULL MARKET from 2009.
A look at the charts shows some bearish divergences starting to show which in the past have all signalled start to significant down moves.

FTSE


DAX


S&P 500


DOW


Tuesday, April 16, 2013

Correction finally here? Fibonacci retraces

Have the equity markets finally reached a short term peak?

Look at weekly charts

FTSE

showing previous corrections related to Fibonacci retracements
So if a correction has started for worldwide indices can probably expect FTSE to find a low either at 38.2 % retrace 6125 or 61.8 %  5955 (approx)


now adding on some trend lines


DOW weekly


Monday, March 18, 2013

Perspective

The TREND is UP for most things, despite today's drop. Is today's drop the start of more significant correction? Or a bear trap?

FTSE

Sell support?or BUY support?


Tuesday, March 5, 2013

Finally a break out to the upside imminent

Are the markets poised to break higher..finally?
The consolidation has been longer than expected BUT
the downside has been limited
the weak longs are probably shaken out
the bears have been given some hope

so NOW the market may be ready for new highs

FTSE  4 hr chart
A break above 6426 and holding should mean a new high for the FTSE.
and eventually possible all time high


DAX

Similar to FTSE long consolidation after rally from November.  Again, despite only giving back max 4% the sentiment has been increasingly bearish.
Next hurdle for DAX is 7865


Euro vs USD

All currencies have been weak vs the USD recently. On the Euro daily chart it looks like some positive divergence creeping in.  Euro may be due for a rally, and conversely the dollar due a fall?


AAPL

still not getting any love and hatred increasing. 406 next support after that 380
Yesterday finally filled a gap
Despite AAPL falling NDX has been holding well, if/when AAPL rallies NDX has a bull flag target of 2900


Quick look at NDX


Tuesday, February 26, 2013

Rally not finished ..YET

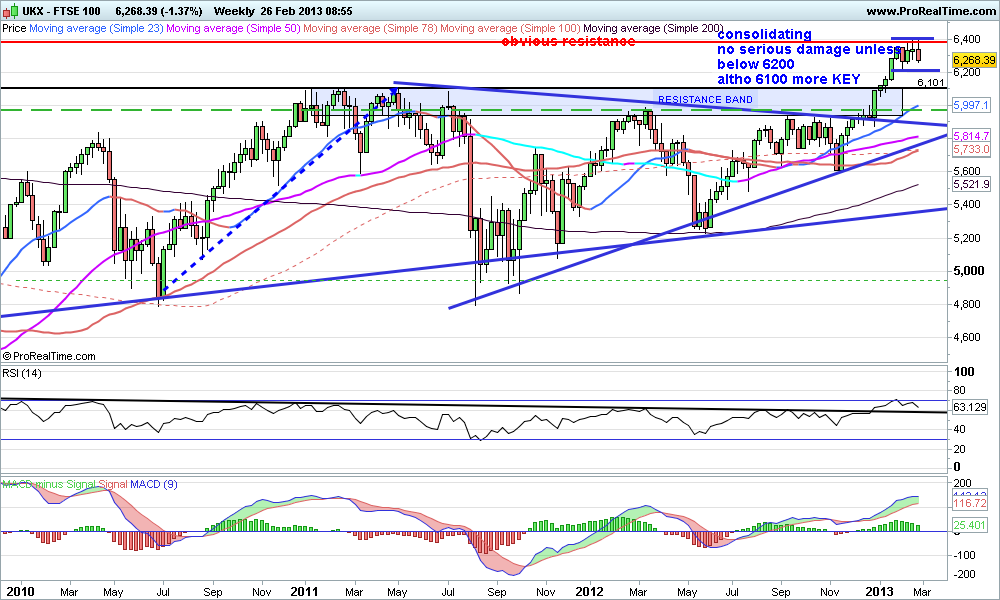
Even though it feels like it yesterday's falls in equity markets (blamed on various things..Italian elections, US FISCAL CLIFF part II! etc etc) probably is NOT the beginning of a sustained bear market move.
Sentiment has reversed quickly , with the FEAR factor rising  rapidly..NOT normally the way BEAR mkts start

Looking at the weekly charts

DAX

Weekly chart
Hovering at support 7570/7580
would need to break that significantly for more sustained correction

trend line support and horizontal support  seen better on DAILY chart


FTSE weekly


Daily chart


Wednesday, February 20, 2013

FTSE Next stage of rally

Looks like the consolidation has finished..now where

FTSE daily

found support at mid line of the up channel
Looks like should test upper boundary @ 6456 (approx)
TREND still UP


FTSE weekly

At resistance 6380. next target 6550
ALL time high looks like it will be tested, not necessarily bested.


Wednesday, February 13, 2013

Consolidation over?

DAX and FTSE have been consolidating after rally from November lows.  Is the consolidation finished?

It's looking increasingly like it.  Markets have given very little back; bears will be getting nervous, and buyers seem to be pressing.  The next rally could be the end of this run, but with quite a lot of bears around it may run further than expected.

FTSE
Looks like it has respected the channel it is in and bounced off the mid point
rally should head towards upper boundary 6426


DAX

seems to have found support at 7570
above 7726 should accelerate as bears give up
target minimum the highs..7860 though probably higher


NDX Nasdaq 100

After the big gap up traded in range 2700 /2760
very dependent on AAPL 
BUT has broken above that range
expect support 2750.2760
rally should carry eventually to 2890 or higher
Use AAPL weakness to buy dips!!


AAPL

Stiff resistance at 500
probably range bound 440 to 500


DJIA

 high level consolidation
everyone "expecting " correction
so probability is it heads higher..
a break above 14200 may accelerate


Wednesday, February 6, 2013

Can't see the wood for the trees!

Imagine looking at an oil painting from a distance of a couple of inches? You would not see much of the whole picture, a few splodges of paint.

Sometime charts can be like that especially if one is looking at them day in day out.  So at times it is best to STAND back so one can see the whole picture. That is look at the LONGER time frames, like the Monthly and Weekly charts.  Then it may become clearer what that picture is telling one!

Monthly Charts below
Pretty self explanatory

AUDUSD


CABLE


EURUSD


FTSE


DAX


DJIA


Total Pageviews