Quotes

Look back over the past, with its changing empires that rose and fell, and you can foresee the future too.

— Marcus Aurelius

Followers

Search This Blog

Showing posts with label copper. Show all posts

Wednesday, September 12, 2012

Summer ended..

Click prices for links to prior posts

Copper now at 371 
DAX 7350
FTSE 5800
Gold 1740
Silver 33.6


Where now?
DAX weekly

DAX approaching strong overhead and downtrend resistance.  Could be we get a brief push above, before a correction sets in.  However unless the trend changes that will be all it is .. a correction.


FTSE weekly

Also approaching resistance

Needs to break and hold above 5810, for test of 5870/5890
Formidable resistance around 5900.

IF the market can break higher obvious target is 6000


DAX/FTSE spread chart

When there is an uptrend can see that DAX outperforms FTSE.

Reasons? 
1, FTSE is quite heavily weighted with defensive stocks
2, DAX has only 30 stocks compared to FTSE 100, and many are cyclical risk on stocks.

However sometimes the spread widens too much.  For a relatively risk free trade sell DAX buy FTSE at these levels, possibly 200points, before uptrend resumes

When a prolonged market down turn occurs the tables are turned with the FTSE outperforming the DAX, in which case a spread trade can be held for longer


Friday, August 17, 2012

Copper

Copper looks ready to have a big move
COT data suggests UP

chart could go either way ..obviously BUT looks to be forming a base..so giving it 80% chance of upside break.


Crude oil almost reached it's target as per previous post

Tuesday, May 29, 2012

COPPER

Thermometer for the global economy

Weekly

Approaching the lower risk "BUY ZONE"

Speculative buy at the trendline support


Daily chart 

Approaching oversold on RSI
Trendline support

BUY on weakness


Monday, April 16, 2012

Copper update

More weakness today and pushing through the upward trend line..now it could be a FALSE break.  Wait for follow through to downside, or if it fails then chances increase that it's a false break and the triangle target at 440 remains


Wednesday, April 11, 2012

COPPER at key level

Copper is taking it's time to find a way to the target from the break out of the symmetrical triangle and after yesterday's fall is right at the rising trend line, which SHOULD be support..HOWEVER the picture is less clear now and a fall through here could see a significantly sharper fall.


Volume on yesterday's drop was high..and may have exhausted the drop..
Worth keeping eye on as Dr Copper usually is a good indicator of the world economy...

Monday, March 5, 2012

Waiting...

Still waiting for the markets to move one way or other..
FTSE still stuck in 100 point range, DAX near resistance at 7000, DOW near 13,000, NASDAQ Comp near 3000...

FTSE 


DAX


The large black arrow shows the RESISTANCE it has to go through for additional gains.
Methinks not this time..


BUT................

some warning signs in other asset classes like currencies and commodities. OIL is weaker and  COPPER also seems to want a bigger retrace before any greater rally.

AUDUSD is struggling after an attempt at breaking out of a BULL FLAG ..CONSOLIDATION last week at 1.08.  If it doesn't do it soon, a failed break out is a good signal for a decent move the oppsoite way..ir DOWN vs USD.

On the MONTHLY chart some Elliott Wave numbering for fun..
Could it be we are seeing a truncated 5th wave?Truncation A truncated fifth wave does not move beyond the end of the third. It can usually be verified by noting that the presumed fifth wave contains the necessary five subwaves, as illustrated in Figures 6 and 7. Truncation gives warning of underlying weakness or strength in the market. In application, a truncated fifth wave will often cut short an expected target. This annoyance is counterbalanced by its clear implications for persistence in the new direction of trend.

Here is a graphical representation of a truncated 5th wave


and here is the AUDUSD monthly chart


Thursday, February 23, 2012

Commodities Gold, silver, Crude oil, Copper

GOLD

broke out now looking to challenge 1800 resistance level.


SILVER

Approaching down trend line, and 200 day MA at 35.03.
a break above could see sharp rally


CRUDE OIL


Above resistance at 104, after large consolidation.  Oil short term overbought, but with tensions rising with Iran, should not give much back and may well be on to much higher targets 129 (measured move). Initial target 111/115 before significant correction


COPPER


Copper may also have competed a correction from overbought levels.  Key level downside 365. If correction over should now be heading to 400, and beyond that the triangle target is still at 450 ish.


Thursday, February 16, 2012

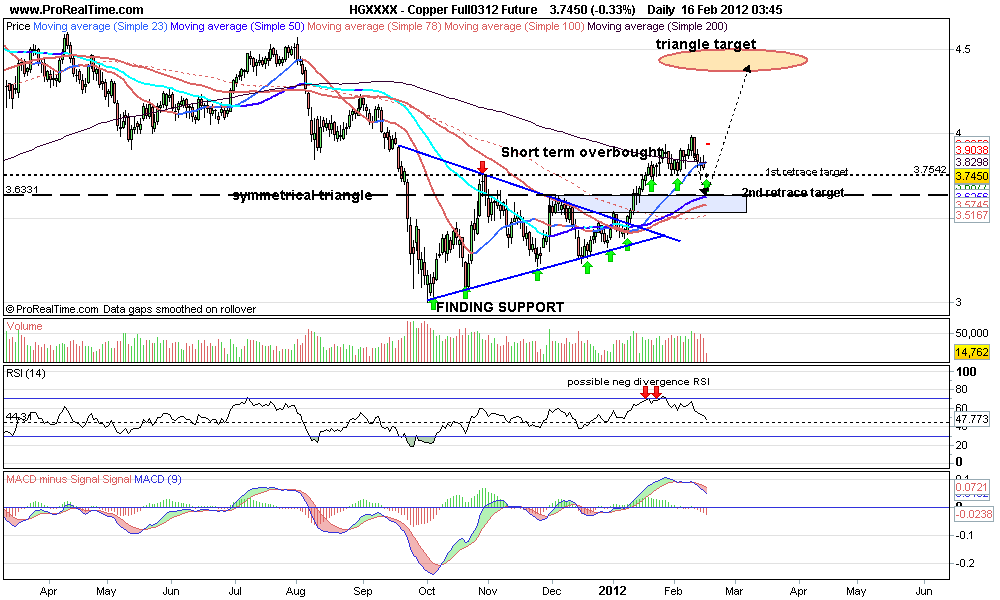
Copper back to first support level

Copper still on target for higher levels form the triangle break out pattern.

Now retracing at first support 374/373 (previous high)

Possible to get move down as low as 365 (retest of the break out level)

Basically overbought indicators are now reset..

COPPER DAILY


Monday, February 13, 2012

Copper and Crude

Copper has been leading the "RISK" rally since mid December, BUT now looks like a rest is needed with NEGATIVE DIVERGENCE shown on the chart, also coinciding with short term dollar strength...

Possible move to as low as 365, but 375 looks more likely before resumption of the trend UP, targeting 440/450 ..

COPPER DAILY 


CRUDE OIL also looks close to breaking our of recent consolidation and a move above 100/101 could start the next leg up there targeting 114 minimum..


Thursday, January 26, 2012

Copper nice move up, time for a rest?

Copper broke out of the triangle
and now looks a little over extended on the daily chart...HOWEVER the upside target from the triangle is still in the region of 439..

BUT there should be a pullback soon which would be a good long entry.  Maybe even if nimble some small shorts to play the correction could be had...risky against the trend..


Wednesday, January 25, 2012

FTSE perfect retest ..so far!

Perfect retest of the consolidation area in the FTSE at 5720...(so far)...as per yesterday's post click here

Today's 4 hr chart so far...


Now it needs some follow through to the upside, a break above 5782 brings the next area of resistance into play  around the 5810 level.("STICKY AREA").  It's also good to look at other markets eg DAX, COPPER for clues as to possible path for the next few days.

The DAX is similar in a need to break above last high at 6470, BUT then there is little resistance up to 7000.
Look at the DAILY chart

Dr Copper is also rallying last at 380 and looks to be on way to the 430 level 

Last but not least..despite markets having rallied for the last few weeks..this has been in the face of skepticism and disbelief from many quarters and a lot of blog forums show "people" looking for tops...so it seems that the rally may continue for longer than expected..buy on weakness..


Tuesday, November 29, 2011

Commodities

SILVER


Silver...seems to be at support..around 30 USD. could have a move up to 35, and ideally a move up to 38/40
where it may be a SHORT

COPPER

Copper also looks like finding support at around 325..
Move to 400? on the cards

CRUDE OIL
Slightly different chart...
Broke uptrend last week...now is that enough of a breather for a run to new highs?
Was overbought, recent sell off has reset indicators..
A break of 95 to downside changes bullish view


Thursday, October 6, 2011

Copper..short /medium term buy?


Pretty self explanatory..looks like we are in the "buy" zone, and good stop level (if we go below the red zone, history shows it can be a fast move down) not far away...anywhere near the blueish line ...a sell..

Total Pageviews