Quotes

Look back over the past, with its changing empires that rose and fell, and you can foresee the future too.

— Marcus Aurelius

Followers

Search This Blog

Showing posts with label rsi divergence. Show all posts

Friday, November 16, 2018

Battle at the line - a look at the DJI

markets are still volatile with large intra-day moves
It seems that buyers are stepping in on the falls and sellers are selling the rallies..

At some point one side will dominate...

at the moment based on charts - the bears have the upper hand..

Look at the DOW first.
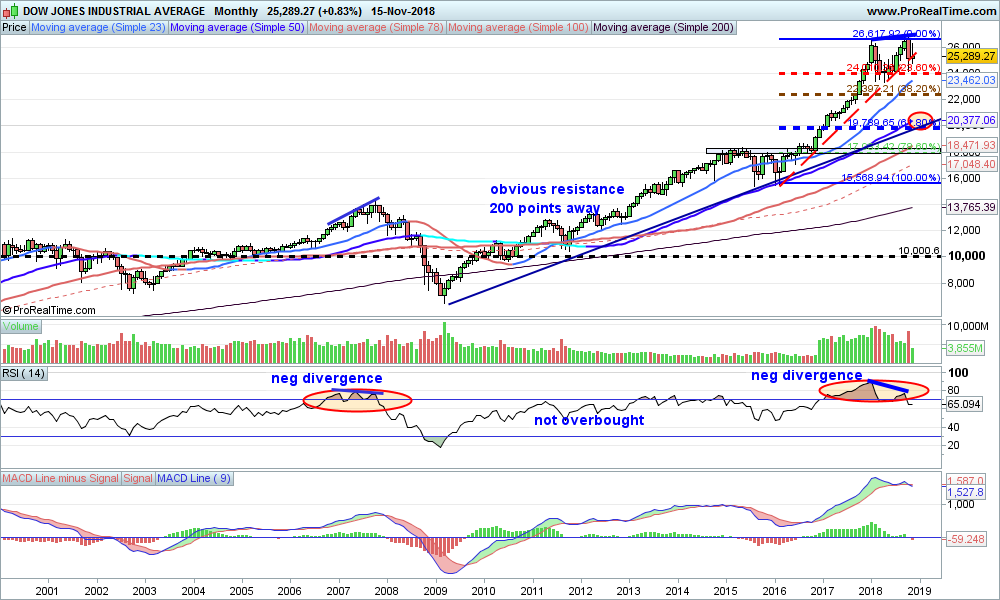
Monthly chart gives perspective...
It shows the extend of the rally.

At a minimum it should correct the rally from 2016, and looking at Fibonacci levels, 23.8 % would be around 24k.
38.2 % would be 22500, or thereabouts
61.8 % level is 19700  (BIG correction) - this level may tie in with a correction of the rally from 2008 i.e. a larger correction.

IF this is a correction of the rally from 2008 (about 7k to 27k) the corresponding fib levels would be:
23.8 % - c 22k
38.2 % 19k
61.8 % 14300  -

Notice that 61.8 % level of the smaller correction is similar to the  38.2 % level of the larger correction (KEEP 19k in mind)

ALSO notice the negative divergences between price and RSI which is a clue that a decline is on the cards

Zooming in to the weekly; shows key levels a bit clearer


Finally even shorter term , the DOW daily

This shows the battle between buyers and sellers at that trend line, with a break and then rally, and again another break.
The next post will be about the psychology of these breaks of trend, ANIMAL BEHAVIOUR - (or if you're precious about the human race , HUMAN behaviour)


Wednesday, November 14, 2018

13 - unlucky for some -

Crude oil.

13 days down

"What goes up must go down" and vice-versa.

When will it bounce?


The chart shows the steep down trend which is still in force...
BUT conditions look oversold.

Trading is all about probability..

Chances are increasing that there will be a snap back...at least to test the down tend.

I would expect then another test of the lows and possibly a lower low, but watch the RSI - if it fails to make a new low probability then increases for a more sustained rally.

Until then nimble trading ..


Tuesday, October 30, 2018

More volatility - roller-coaster ride in US yesterday

As per yesterday's post (Note 3 on the DOW) markets were trading with more volatility, DOW has an intraday swing of 900 points - up strongly in the morning collapse in the afternoon and finally recovery at the close.

Was that the wash out for the move down? 

Is it rally time?


Evidence for end of down move:
1.  wedge broke to the downside and quickly recovered
2 Possible positive divergence RSI and price (still not confirmed)

However:
1 the recovery to me seemed to be short covering and dip buying
2  on shorter time frames the price has hot a new low and so has the RSI
3. Price is STILL contained in the wedge

So I think more volatility and another test of the wedge boundary (lower)

Needs a break above the top boundary to signal that the down move may be over

Tuesday, March 5, 2013

Finally a break out to the upside imminent

Are the markets poised to break higher..finally?
The consolidation has been longer than expected BUT
the downside has been limited
the weak longs are probably shaken out
the bears have been given some hope

so NOW the market may be ready for new highs

FTSE  4 hr chart
A break above 6426 and holding should mean a new high for the FTSE.
and eventually possible all time high


DAX

Similar to FTSE long consolidation after rally from November.  Again, despite only giving back max 4% the sentiment has been increasingly bearish.
Next hurdle for DAX is 7865


Euro vs USD

All currencies have been weak vs the USD recently. On the Euro daily chart it looks like some positive divergence creeping in.  Euro may be due for a rally, and conversely the dollar due a fall?


AAPL

still not getting any love and hatred increasing. 406 next support after that 380
Yesterday finally filled a gap
Despite AAPL falling NDX has been holding well, if/when AAPL rallies NDX has a bull flag target of 2900


Quick look at NDX


Tuesday, December 18, 2012

APPLE

AAPL

Daily chart, seems to be setting up POSITIVE divergence (price makes new low, but RSI does not).

Sentiment: seems nobody likes AAPL at 500 !! Yet at 700 EVERYONE wants to BUY.

Some sayings which could be applied to AAPL now.

BUY in the red , SELL in the blue, ie Buy when others are selling and sell when others are buying.

Warren Buffet " Be fearful when others are greedy, Be GREEDY when others are fearful"


Tuesday, June 12, 2012

EURUSD LONG?

Weekly chart

starting to show signs of positive divergence, ideally a test of recent lows to reinforce the signal.
Shorts still at LARGE!


Daily chart


Tuesday, May 29, 2012

IBEX capitulation selling starting?

Is the selling today the start of the capitulation?

May be a BUY soon..
IBEX down 2.62 % vs DAX up 0.7%

quick look at charts Monthly weekly and daily

Monthly
Key level on downside 5280 Monthly Support


and then 3910/4000


Weekly 

starting to go oversold


Daily
Positive divergence didn't do much for the price.  Indicators which were oversold now reset so another leg down possible to oversold again.  Maybe a positive divergence on bigger time frame setting up..


Wednesday, May 23, 2012

¿Donde va el IBEX 35? Whither the IBEX 35?

IBEX mensual

Soporte roto      (support broken)
todavia no sobre vendido  (not oversold yet)
Próximo soporte 5100 !!!  (Next MAJOR support 5100)


IBEX semanal
Ha roto soporte @ 6600

Support broken at 6600


IBEX diario

A corto plazo empezando a formar divergencia positiva..puede que haya una subida por compra de posiciones vendidos a corto.

Short term beginning to show positive divergence between price and RSi, may lead to a SHARP short covering rally before resuming the down trend..
SHOULD coincide with rally in the major markets


Thursday, January 19, 2012

FTSE stepping back to see the full picture

FTSE monthly chart


LONG term view...
just for perspective..
If bulls start running could be at minimum challenge of 6100 level, and if that breaks then test of all time highs...SCARY!

RSI is neutral, MACD could be in process of turning up

Tuesday, January 10, 2012

EURO weakness coming to an end ...(medium term)

There are record numbers of EURO shorts and looking at the DAILY chart of EURUSD we can see some positive divergences building ..POSITIVE DIVERGENCE between PRICE and RSI.  


This is when the PRICE reaches a NEW LOW, but the RSI doesn't


This is highlighted on the chart (first circled area) and the current situation in the 2nd circled area.


On the EURJPY the divergence is clear on the WEEKLY chart each time generating a short squeeze rally.


Thursday, November 26, 2009

EURO....

Still in up trend and making NEW highs since March..BUT....

the RSI seems to be lagging this move...bearish divergence.. watch 1.5230 level...


Total Pageviews