Quotes

Look back over the past, with its changing empires that rose and fell, and you can foresee the future too.

— Marcus Aurelius

Followers

Search This Blog

Showing posts with label crude oil. Show all posts

Wednesday, December 19, 2018

Crude oil

No bottom yet - despite quite oversold conditions
What do the charts say?

Weekly chart - what does it say?

Oversold - BUT price and RSI going to new lows - no divergence yet so selling pressure still evident
Next major support - shaded area, with possible overshoot
If that doesn't hold crude is headed lower


What about shorter time frames?

Crude oil daily

Getting close to oversold
POSSIBLE positive divergence setting up - as a new low with RSI looking like it will not form a new low


Crude 2 hour chart
Stepping down the stairs
Nice bear flags on the move down
Looks like at least one more setting up


Worth keeping eye on especially if it gets to the support highlighted (set alert for 42.9)
once the down move is finished - there should be a decent rally (corrective)

Wednesday, November 21, 2018

Crude thoughts

So crude oil has been relentlessly sold over the last month and a half..

remember things can go down in a straight line but not forever..

So is it time for a BOUNCE?

Look at the evidence, comparing price action and RSI.

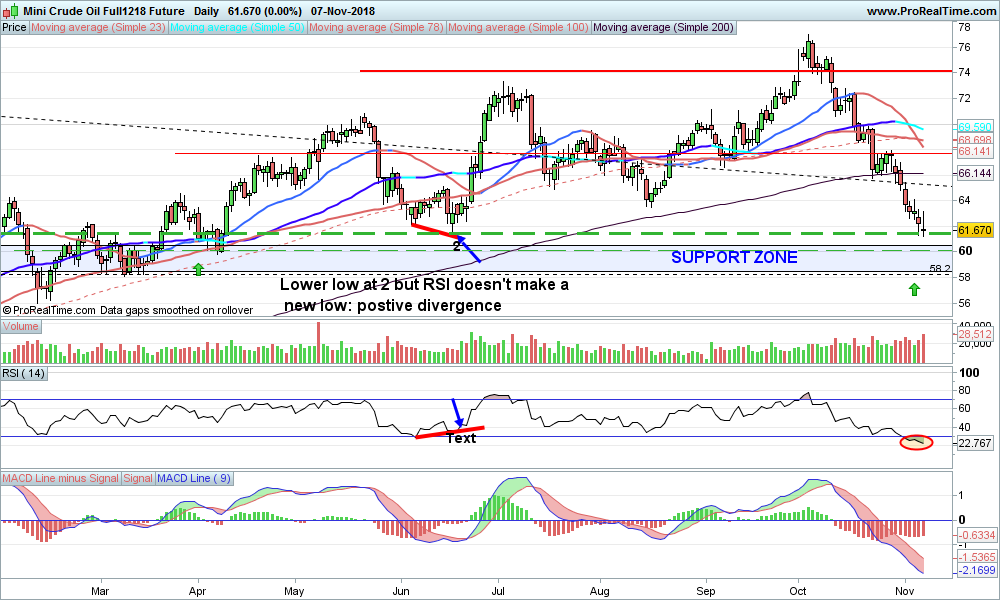
On the daily chart there is positive divergence showing now (remember not an exact science), but this does show that the recent selling may be abating.

So where will the bounce go to?
Well using Fibonacci retracements (more on Fibonacci in the natural world also known as the Golden Ratio click here) .  Was God a mathematician ?  (video link) we can get an idea of where it may bounce to.

So if we look at the daily chart of crude, what is the positive divergence?
1. price has made a new low
2. RSI in the lower panel has not
indicated by the blue trend lines.

Will the move up be sustainable?
Well the down move was strong so any move up will be corrective, in Elliott Wave terms , the move up will be 3 waves (A-B-C) .

Then if OIL is in a bear move (evidence? - world is slowly changing to alternatives, electric cars, wind power, solar power, this will gather pace so oil may lose it's  standing as an indicator for the world economy over the medium term)
The next leg down will be even larger than this one if it is a wave 3 down (Elliot Waves - impulses are 5 waves)


Minimum target would be the 23.8 % retrace level ; Oil however tends ot overshoot both on the downside and upside so 38.2 % retrace is a very valid target.

Wednesday, November 14, 2018

13 - unlucky for some -

Crude oil.

13 days down

"What goes up must go down" and vice-versa.

When will it bounce?


The chart shows the steep down trend which is still in force...
BUT conditions look oversold.

Trading is all about probability..

Chances are increasing that there will be a snap back...at least to test the down tend.

I would expect then another test of the lows and possibly a lower low, but watch the RSI - if it fails to make a new low probability then increases for a more sustained rally.

Until then nimble trading ..


Thursday, November 8, 2018

Crude oil 3 charts


Monthly chart (top) shows a LONG term view.  Longer term oil is still in a down trend from it's peak at around 200 USD per barrel.

Weekly chart (middle) shows that price is approaching a support zone, previous support and resistance area around the 58 USD mark.
Not oversold yet on weekly.

Daily chart:  shows the support zone more clearly.  Looking oversold but no divergence between RSI and price.
See below for an example of positive divergence between price and RSI


Friday, August 17, 2012

Copper

Copper looks ready to have a big move
COT data suggests UP

chart could go either way ..obviously BUT looks to be forming a base..so giving it 80% chance of upside break.


Crude oil almost reached it's target as per previous post

Monday, July 16, 2012

Crude oil

Crude Oil seems to have found a short term bottom and looks set to rise substantially as do most commodities

Bull flag target 96 ..but oil tends to overshoot on upside and downside, so more is possible.


Monday, March 5, 2012

Waiting...

Still waiting for the markets to move one way or other..
FTSE still stuck in 100 point range, DAX near resistance at 7000, DOW near 13,000, NASDAQ Comp near 3000...

FTSE 


DAX


The large black arrow shows the RESISTANCE it has to go through for additional gains.
Methinks not this time..


BUT................

some warning signs in other asset classes like currencies and commodities. OIL is weaker and  COPPER also seems to want a bigger retrace before any greater rally.

AUDUSD is struggling after an attempt at breaking out of a BULL FLAG ..CONSOLIDATION last week at 1.08.  If it doesn't do it soon, a failed break out is a good signal for a decent move the oppsoite way..ir DOWN vs USD.

On the MONTHLY chart some Elliott Wave numbering for fun..
Could it be we are seeing a truncated 5th wave?Truncation A truncated fifth wave does not move beyond the end of the third. It can usually be verified by noting that the presumed fifth wave contains the necessary five subwaves, as illustrated in Figures 6 and 7. Truncation gives warning of underlying weakness or strength in the market. In application, a truncated fifth wave will often cut short an expected target. This annoyance is counterbalanced by its clear implications for persistence in the new direction of trend.

Here is a graphical representation of a truncated 5th wave


and here is the AUDUSD monthly chart


Tuesday, February 28, 2012

Crude oil and petrol prices

Well after filling up the car a week and a half ago at 1.41€ per litre, and yesterday noticed that it has now gone up to 1.44€ a litre a 2.12 % increase in under 2 weeks!


So the increase is all blamed on rising crude oil prices ..HOWEVER in July 2007 crude oil was at a record 180 $ per barrel, and prices at the pump reached the low 130's (centimos) per litre...


Look at the graph below you can see that prices at the pump dropped when crude oil dropped , BUT since then have raced ahead of crude oil prices


The blue line = prices at pump
Since Jan 09 crude oil has been rangebound roughly 80-110 USD per barrel, yet the prices at the pump have continued to rise....


As usual Europeans continue to pay through the nose for petrol and governments continue to rake in tax revenues the higher it goes...


Thursday, February 23, 2012

Commodities Gold, silver, Crude oil, Copper

GOLD

broke out now looking to challenge 1800 resistance level.


SILVER

Approaching down trend line, and 200 day MA at 35.03.
a break above could see sharp rally


CRUDE OIL


Above resistance at 104, after large consolidation.  Oil short term overbought, but with tensions rising with Iran, should not give much back and may well be on to much higher targets 129 (measured move). Initial target 111/115 before significant correction


COPPER


Copper may also have competed a correction from overbought levels.  Key level downside 365. If correction over should now be heading to 400, and beyond that the triangle target is still at 450 ish.


Monday, February 20, 2012

Crude oil heading to 111 target

Crude oil still heading to 111 minimum target short term , and more likely higher medium term

CRUDE OIL weekly chart

AB leg followed by consolidation, classic BULL FLAG.  Now broken up above the top of the flag, could get move to 129, which is where CD = AB leg up.  Also coincides with 50% Fib retrace of fall from July 2008 highs.


CRUDE DAILY CHART

Daily looks like approaching overbought, so some sideways corrective action ahead.
BUY on weakness..


CRUDE 2 HR CHART


Wednesday, February 8, 2012

Fake out to the downside Crude and Euro

Crude oil managed to spook yesterday with a nice fake out to the downside, and probably encouraged some short selling and/or triggered stop losses for longs...before reversing sharply higher...

30 min chart below..


So still in the potential BULL FLAG.. and now more likely to see a break above 101 (after a bit of time to digest yesterday's gains) 

The daily chart shows the FLAG
MACD looks to turn up
Upside target if it breaks North could be as high as 121


The €/$ also did a similar move, not quite as dramatic but tested the 1.3030 level, before reversing sharply higher and breaking resistance at 1.3225

Same as for oil, expect some back filling but should head to 1.35 minimum, and after hearing CNBC commentators yesteray advising selling into strength this may go as high as 1,40!! (good contrarian indicator)


Tuesday, February 7, 2012

Crude oil..still consolidating or forming a top?

Crude oil still in a channel...trending lower, BUT is it a bull flag or topping?

Daily chart


Personally it looks like after the bottom formed in Oct 11, which showed bullish divergence between Price and RSI, we had a STRONG LEG up  to the November high, and since then it looks like it is in consolidation for at LEAST one more leg higher.

A significant break of the December lows would change that

STRATEGY if bullish : buy on weakness, or wait for a break above 101

Weekly chart


RSI seems to have found support, only negative is MACD may be about to cross down, BUT lagging indicator and many time it approaches the signal and turns up.


Wednesday, February 1, 2012

Longs win again

DAX has broken through it's recent high

FTSE still needs to get there

Euro on it's way to 1.35 minimum

Oil  tried to break out of the bull flag yesterday and was pushed back..so probably quite a few longs were stopped out and maybe even more shorts stepped in..

Now need to see how it reacts .if it can hold these levels 98 -99 USD then I think we see another attempt at a breakout, measured move if a BULL FLAG 114


Tuesday, November 29, 2011

Commodities

SILVER


Silver...seems to be at support..around 30 USD. could have a move up to 35, and ideally a move up to 38/40
where it may be a SHORT

COPPER

Copper also looks like finding support at around 325..
Move to 400? on the cards

CRUDE OIL
Slightly different chart...
Broke uptrend last week...now is that enough of a breather for a run to new highs?
Was overbought, recent sell off has reset indicators..
A break of 95 to downside changes bullish view


Friday, November 18, 2011

Crude ready for a correction?

The news channels (CNBC etc) all highlighting crude as it hit 103 yesterday...not being a CYNIC but usually they get excited at the top of the market, anyway the chart shows crude had been straight up (more or less) since Oct 4

Time for a breather?


DAX daily A look at the CHOP!!


Well July to September was a noce move down and the rally off the lows in October was also a good tradeable move...NOW we are in that circle of CHOP///

Note: Key is preservation of capital...

Personally I feel the bullish scenario will win once this chop is over..too many bears looking for the drop, high VIX (volatility), and  DESPITE the bad news, EU coming to an end,  blah blah blah...we are in a CHOP...

Obviously as in all trading many scenarios could play out...but i give the BULLISH case 75% and the bearish case 25%..

Well it's FRIDAY so not a good day to bet big either way..

Short OIL
Long DAX
Short EURO/DOLLAR
Long FTSE (day trade)
Short DOW

DOW DAX spread chart
at  these levels looks good to buy DAX and Sell DOW


Wednesday, September 30, 2009

Wednesday, April 22, 2009

crude

self explanatory...

weakness in crude = weak equity markets

Thursday, January 15, 2009

Crude oil longer term


Copy and paste link below for interesting thoughts on crude

http://www.cnbc.com/id/15840232?video=994375164

Another fall to a new low might be needed to end this dramatic move down...while oil is falling can't see any rally in equities..

Short term play to upside if this happens..key level to watch 30 usd; significantly below that 17 usd...

Thursday, December 11, 2008

Some more CRUDE thoughts

Crude oil and commodities generally have had a good rally over the last 2 days. Spotlight on crude..it has broken above 3rd descending fanline so we may have a push to 62 (65.3 is a 23.8 % retrace of fall from 150). Initial resistance at 48 (being tested today) then 55.5... this rally would tie in with the rally in equities and euro (also seems to have cleared resistance today).

Total Pageviews