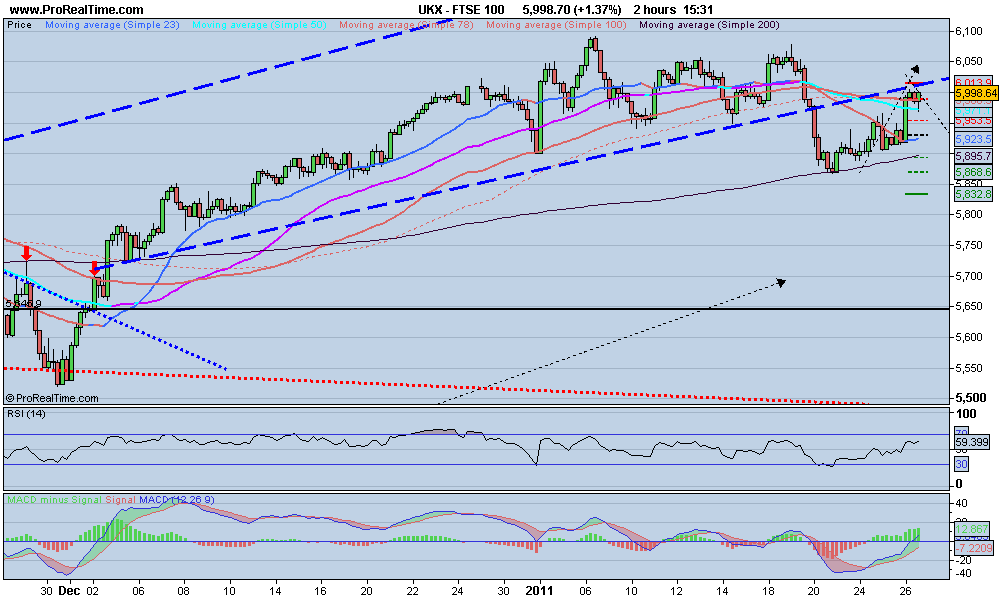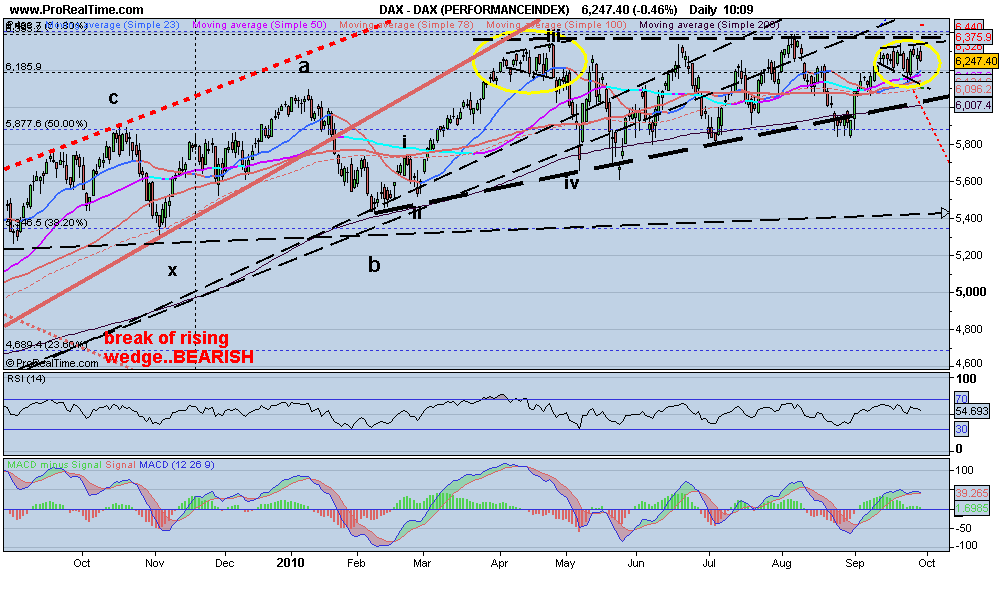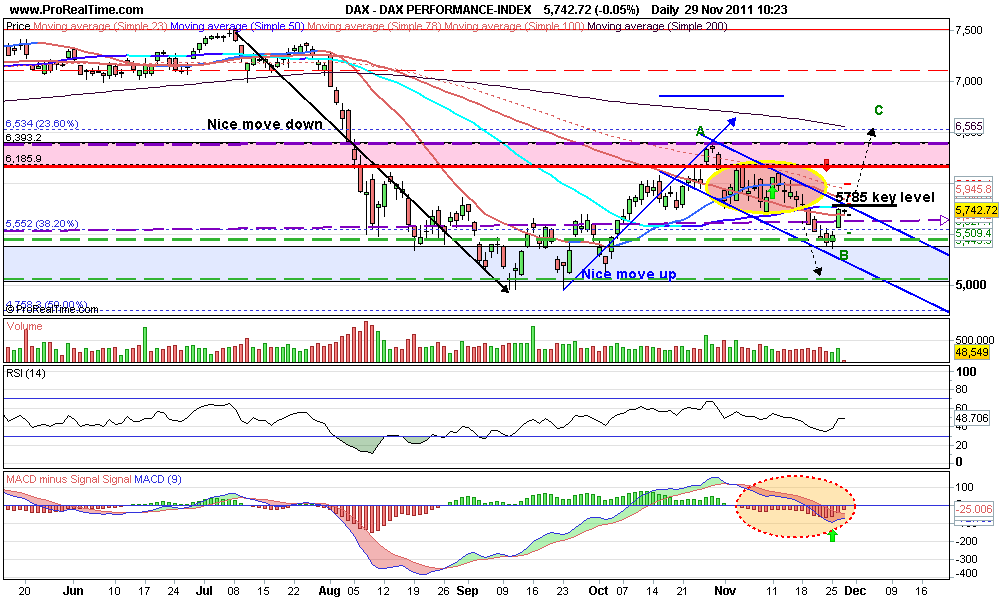
Well the fall out of the chop was a little deeper than expected..BUT we are still in a channel and now approaching a key level 5785.. a break above that and the rally is back on...otherwise we may just trade in the channel.
Things to note..
1. Despite all the negative news markets have not "fallen out of bed" ie they have only given up between 50 - 70 % of the rally from October lows
2. The media are extremely negative on everything.
3. Despite all the negativity surrounding the EURO €, also has held up relatively well
4. Likelihood is that the money is all betting on demise of Euro and Europe...
Looking at the EURO chart
Looks like we could be in falling wedge patterns
If we break out to upside (expected move) then in theory the entire falling wedge will be retraced..
(similar patterns also in AUDUSD and GBPUSD)
Technical analysis of Major Markets, F/X, and anything that can be traded This is my diary for trading Views expressed in this are only for educational purposes. They ARE NOT recommendations to BUY or SELL anything!! ALL comments and criticisms welcome.
Quotes
Look back over the past, with its changing empires that rose and fell, and you can foresee the future too.
— Marcus Aurelius
Followers
Search This Blog
Tuesday, November 29, 2011
Wednesday, November 23, 2011
ALL BAD NEWS?!!!
FT and Marketwatch headlines for today...all negative news..note to self BEWARE of being short at these levels..
Many blogs are touting end of the world scenarios and 2008 comparisons
Holiday in US quiet trading for rest of week
Friday, November 18, 2011
Crude ready for a correction?
The news channels (CNBC etc) all highlighting crude as it hit 103 yesterday...not being a CYNIC but usually they get excited at the top of the market, anyway the chart shows crude had been straight up (more or less) since Oct 4
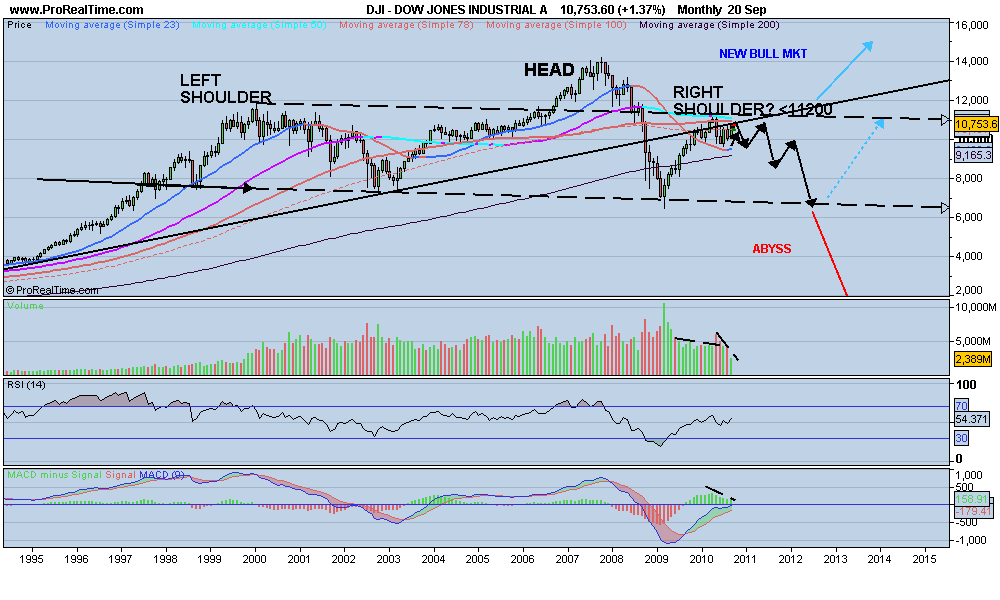
Time for a breather?
DAX daily A look at the CHOP!!
Well July to September was a noce move down and the rally off the lows in October was also a good tradeable move...NOW we are in that circle of CHOP///
Note: Key is preservation of capital...
Personally I feel the bullish scenario will win once this chop is over..too many bears looking for the drop, high VIX (volatility), and DESPITE the bad news, EU coming to an end, blah blah blah...we are in a CHOP...
Obviously as in all trading many scenarios could play out...but i give the BULLISH case 75% and the bearish case 25%..
Well it's FRIDAY so not a good day to bet big either way..
Short OIL
Long DAX
Short EURO/DOLLAR
Long FTSE (day trade)
Short DOW
DOW DAX spread chart
at these levels looks good to buy DAX and Sell DOW
Friday, November 11, 2011
DAX 4 hours...bigger picture
Well the negative news seems to not be able to drive the market significantly lower SO it seems that it will go higher...
Looking at the DAX 4 hr chart 2 scenarios
THE BEARISH CASE
possible H&S pattern with neckline at around 5730 (tested yesterday) and a price target of 5000 (September lows)
THE BULLISH CASE
We moved up from 23rd Sept low and have now retraced 50% of the move up (A to B), and could be in a bull flag formation, and pretty close to a break out to the upside (6000), with a min target of 6600 and possibly even as high as 7200..
LONG TERM
If we completed a wave 1 down at the Sept lows and we are now in a wave 2 up, wave 2's tend to bring back that bullish feeling and can even approach the highs, before we turn down in a WAVE 3 ..THE BIG ONE!!
SO a Xmas rally and into New Year before the next wave down occurs..
Looking at the DAX 4 hr chart 2 scenarios
THE BEARISH CASE
possible H&S pattern with neckline at around 5730 (tested yesterday) and a price target of 5000 (September lows)
THE BULLISH CASE
We moved up from 23rd Sept low and have now retraced 50% of the move up (A to B), and could be in a bull flag formation, and pretty close to a break out to the upside (6000), with a min target of 6600 and possibly even as high as 7200..
LONG TERM
If we completed a wave 1 down at the Sept lows and we are now in a wave 2 up, wave 2's tend to bring back that bullish feeling and can even approach the highs, before we turn down in a WAVE 3 ..THE BIG ONE!!
![]() |
| DAX 4 hr chart |
Wednesday, November 9, 2011
DAX 2 hours
Well Europe still dominating the news and a lot of nervousness...but maybe too much for a serious market break down?
DAX 2 hours support at 5735 if we break down significantly may head to test lows at 5000..BUT probably a lot of market participants looking for the fall so BEWARE if a false break occurs, could be the thing that ignites the SANTA rally...and then head to 7000 before falling again...
be nimble!!
Thursday, October 6, 2011
Copper..short /medium term buy?
Pretty self explanatory..looks like we are in the "buy" zone, and good stop level (if we go below the red zone, history shows it can be a fast move down) not far away...anywhere near the blueish line ...a sell..
Wednesday, October 5, 2011
AUDUSD possible count
If we have completed a wave 3 the next move up will be a choppy wave 4, possibly to underside of wave 1. Then new lows.. This would tie in with a 4rth quarter rally in all risk assets (equities, commodities etc), and obviously a weakening of the US dollar vs most major currencies...
Sunday, September 18, 2011
DOW charts daily and monthly
Daily chart shows support and resistance..shaded areas.. We may be in process of forming bear flag..possibly still some higher prices to come. A break of 11,000 may signal start of next down leg. So probably more range bound trading for a while. before a decisive move (probability? 70% to downside?)
Weekly chart shows MACD turning down...and looks like crossing to downside...look at previous turn down..
Thursday, March 10, 2011
DAX 1 hr and 2 hr charts
DAX 1 hr chart showing classic triangle, false break a couple of days ago..subsequent shoer squeeze mad a lower high again, today we have the break lower. MIND the GAP DOWN...expecting a fill and add to short..if we get a close back in the triangle..stop out
2 hr chart shows longer view and target area, which can be seen to be previous support and resistance area.
Thursday, February 24, 2011
DAX FTSE spread..again
Well the spread went a little higher than anticipated...added to the position..but looks to be coming in now..
The negative divergence still in play, MACD turning down...
Tuesday, February 22, 2011
DAX monthly or L O N G T E R M ..!
DAX bumping up against some serious resistance around 7540 level..after breaking out of the 6440 level. Longer term we may see test of that level (6440).. shorter term support at 6950 and resistance around 7540...
Key levels to watch... so at 7440 good risk reward ( LONGER term) for a short...a break above 7540 and we test highs @ 8000 !
Thursday, February 3, 2011
SOME more negative divergence CABLE
Shorted at 16210 stop 16320 open target...
If we do break higher could be an IHS formation ..
best seen on weekly chart
Of course being weekly chart important to see a confirmed break out and retest of theneck line..to avoid false breaks.
If we do break higher could be an IHS formation ..
best seen on weekly chart
Of course being weekly chart important to see a confirmed break out and retest of theneck line..to avoid false breaks.
Wednesday, February 2, 2011
FTSE DAX spread UPDATE.....
Following on form previous post...the spread got as high as 1270....now dropping back to 1187. As can be seen on the chart this is setting up an even bigger negative divergence, so we may have a PROPER top in the spread and LONGER term looks like FTSE will outperform the DAX (unless of course it breaks out above that channel.. TA always has alternative scenarios, it's all about probabilities!)
The weekly chart also shows negative divergence. If the spread narrows to 700, potential profit is 1000 pips per unit
Wednesday, January 26, 2011
FTSE DAX spread
Looking at this..
Selling DAX simultaneously buying FTSE especially around 1200 spread....
IF markets start correcting FTSE has traditionally been more defensive than the DAX so in theory the spread should narrow as in previous market corrections/bear trends
Selling DAX simultaneously buying FTSE especially around 1200 spread....
IF markets start correcting FTSE has traditionally been more defensive than the DAX so in theory the spread should narrow as in previous market corrections/bear trends
FTSE follow up
Well the FTSE is retesting that broken trend line. Now what? Well the DOW is above 12k, DAX is still struggling against the highs, and actually any selling it seems to lose momentum pretty quickly....
SO my guess is this may turn quite quickly if any selling hits the US mkts. having said that am long FTSE from 5907 trailing stop now at around 5976, any sudden fall and I will be stopped out...
A good trade may be long FTSE short DAX....
SO my guess is this may turn quite quickly if any selling hits the US mkts. having said that am long FTSE from 5907 trailing stop now at around 5976, any sudden fall and I will be stopped out...
A good trade may be long FTSE short DAX....
Monday, January 24, 2011
FTSE topped or consolidating for another push up?
FTSE has broken the short term uptrend
Will it repeat the last down trend forming a BULL flag? One month it took...action in yellow circles
OR has it topped..? Likely test of the broken trend line at 5990 possible also a test of the highs...
Will it repeat the last down trend forming a BULL flag? One month it took...action in yellow circles
OR has it topped..? Likely test of the broken trend line at 5990 possible also a test of the highs...
Monday, December 6, 2010
HI hol Silver
Looks like silver is in final stages of a blow off top...(MAYBE !)
But looking at the monthly chart history seems to say that there will be better opportunities to go long silver...(LONGS look higher risk now)
When it turns it will be painful....for longs. Timing a top on a parabolic move up is also tricky..!!
Monday, November 8, 2010
Tuesday, October 5, 2010
FTSE near some tough resistance
FTSE rally hos now reached the down trend line from 2007 high best seen on weekly chart below:
Also on the daily chart looks close to some strong horizontal resistance areas...is there a possible head and shoulders forming ? ssshhhhh...
Seems like the probability is weighted in favour of a bear move from here, either the BIG one, OR (more likely IMHO) a move back into the rising channel with lower boundary at 5200 ish
![]() |
| FTSE WEEKLY |
![]() | |||||||||||
| FTSE DAILY |
Seems like the probability is weighted in favour of a bear move from here, either the BIG one, OR (more likely IMHO) a move back into the rising channel with lower boundary at 5200 ish
CABLE...
Looks like cable is nearing significant resistance zone...
Could be one more move up to 1.65 if the USD carries on being sold..
Longer term view..MONTHLY Chart
has worked off the oversold condition at point 3
RSI is now back to neutral level
IF wave count is correct longer term should revisit lows ie 1.30 level and possibly more
Monday, October 4, 2010
DAX breaking down from Diamond formation?
Looks like the Diamond Topping pattern is coming to fruition..with today's action (SO FAR!)
http://iberianviews.blogspot.com/2010/10/dax-diamond-formation.html
LONGER TERM
A break of 6060 brings 5850 into play...
http://iberianviews.blogspot.com/2010/10/dax-diamond-formation.html
6124 looks like temporary support, expect a possible retest of the breakdown level around 6200, if we get above 6230 ..back in the range and possible FAILURE of the DIAMOND.
If 6124 breaks , 6080/6060 level next support
A break of 6060 brings 5850 into play...
Friday, October 1, 2010
DAX diamond formation?
"The diamond formation reversal pattern is found relatively infrequently. When it does form, however, it usually does so at market tops rather than at bottoms."
Wednesday, September 29, 2010
DAX topping or consolidation?
Dax has been in a range since Feb this year... UPPER BOUNDARY at 6360
Could be an ascending triangle (bullish scenario) with a break above 6360 signalling new highs..OR could be part of a rising wedge (which if it breaks t the downside would be BEARISH).
Since we are near the TOP of the range got to be short here, looking for at least a test of the lower boundary, or a decisive break lower (VERY BEARISH).
The weekly chart shows possible rising wedge, and the range bound formation, in relation to the all time highs
Could be an ascending triangle (bullish scenario) with a break above 6360 signalling new highs..OR could be part of a rising wedge (which if it breaks t the downside would be BEARISH).
Since we are near the TOP of the range got to be short here, looking for at least a test of the lower boundary, or a decisive break lower (VERY BEARISH).
The weekly chart shows possible rising wedge, and the range bound formation, in relation to the all time highs
Tuesday, September 21, 2010
BACK.....
Kids BACK to school...
Wife BACK to work
BACK to looking at the markets...
Starting off with some LONG TERM charts...
DOW JONES INDUSTRIAL ..The HEADLINE index (the one EVERY one watches, talks about etc)
The KEY level seems to be 11200 on the upside... 500 points away..
VOLUME doesn't SEEM to be confirming this move up.....
Many BEARS are DESPONDENT and some signs of CAPITULATION
Trading near the TOP of a channel..
DAILY CHART
Shows proximity to the monthly channel
Looking extended short term..pullback then a final move up to test that channel?
DAX MONTHLY
Also nearing RESISTANCE best seen on WEEKLY and DAILY charts..
DAX WEEKLY & DAILY CHARTS

Wife BACK to work
BACK to looking at the markets...
Starting off with some LONG TERM charts...
DOW JONES INDUSTRIAL ..The HEADLINE index (the one EVERY one watches, talks about etc)
The KEY level seems to be 11200 on the upside... 500 points away..
VOLUME doesn't SEEM to be confirming this move up.....
Many BEARS are DESPONDENT and some signs of CAPITULATION
Trading near the TOP of a channel..
DAILY CHART
Shows proximity to the monthly channel
Looking extended short term..pullback then a final move up to test that channel?
DAX MONTHLY
Also nearing RESISTANCE best seen on WEEKLY and DAILY charts..
DAX WEEKLY & DAILY CHARTS

Wednesday, August 11, 2010
NO CHANGE!!
Am on holiday, and there is no change for the markets in my view...
This previous post sums it up...click on it to see
A move above this years high delays the eventual process, but only delays.
DAX fractals still there...
Am in the UK and the noise on the ground is not good...companes looking to reduce staff further, house prices stalling again...
This previous post sums it up...click on it to see
A move above this years high delays the eventual process, but only delays.
DAX fractals still there...
Am in the UK and the noise on the ground is not good...companes looking to reduce staff further, house prices stalling again...
Saturday, July 17, 2010
AUDUSD weekly..
Bear case..I like the 23 week ma moving below the 50 week ma ..just...waiting to see if we get a more decisive move down..or if this is consolidation for a move higher...
We could be forming a bear flag for the next move down in which case I expect a break of the "flash crash" lows around 80..
if we are in a bull run a move above 89/90 means new highs or at least a test of the old highs
We could be forming a bear flag for the next move down in which case I expect a break of the "flash crash" lows around 80..
if we are in a bull run a move above 89/90 means new highs or at least a test of the old highs
Tuesday, July 13, 2010
FRACTALS
Looking at DAX weekly something caught my eye..maybe it's the heat!
The areas highlighted by rectangles look similar,,looks like one more thrust up to test resistance at 6340..then a pull back..one more test and ...F
A
L
L
A break above 6340 (clear) means new highs probably due..
The areas highlighted by rectangles look similar,,looks like one more thrust up to test resistance at 6340..then a pull back..one more test and ...F
A
L
L
A break above 6340 (clear) means new highs probably due..
Thursday, July 1, 2010
USDJPY
Seems like YEN strength vs dollar = weak equity markets, so here's the USDJPY weekly..
Looks like tracing out a triangle, and a break below the lower line could tie in with a BIG fall in equity markets. May be that we stay in the range for a while longer, as it is a weekly chart...but more warning signs??
DOW very LONG TERM
Just trawling through charts, here's DOW Industrial with lines drawn from a while ago, the arrows are recently added...
EURO GBP short term bottom or near?
Haven't looked at EURGBP for a while (due to personal circumstances been out for a while), but we broke down through 0.8455, but we have hit the lower descending trend line at around 0.8100 and bounced. This looks like could be key, though we are still in a DOWN TREND, may be a warning that EURO may have a period of strength vs Pound (which ties in with the previous post on cable).
Obviously a clear break below 0.81 and we could test as low as 0.78
CABLE
Recent rally "looks" like it could be ending, if so we could see 1.41 at a minimum over medium term.
Wednesday, June 30, 2010
DAX BIG head and shoulders still possible
Here's the chart from March 2010
and here is the one as of today...we are still in that large formation
A break through that red dashed line and all hell breaks loose , until then looks like we are still in that range 5600-6300 approx
and here is the one as of today...we are still in that large formation
A break through that red dashed line and all hell breaks loose , until then looks like we are still in that range 5600-6300 approx
Subscribe to:
Posts (Atom)