DAX
The BULL move since Sept 2011 is STILL intact and EVEN a fall to 7950 wouldn't change this much.
If it finds support at or above this level, a good chance of new ATH or at least a retest of the highs.
ALTernative : The market is in the process of correcting the advance from JUNE 2011 a 62% retrace would be around 7050
OR the market is correcting the advance from SEPTEMBER 2011 , a 62 % retrace would be 6400
Obviously the latter scenarios (IE bigger corrections) will not be straight line affairs, but would change market from BULL to med term bearish (or short term bearish to med term bearish)
Technical analysis of Major Markets, F/X, and anything that can be traded This is my diary for trading Views expressed in this are only for educational purposes. They ARE NOT recommendations to BUY or SELL anything!! ALL comments and criticisms welcome.
Quotes
Look back over the past, with its changing empires that rose and fell, and you can foresee the future too.
— Marcus Aurelius
Followers
Search This Blog
Wednesday, September 4, 2013
Wednesday, August 28, 2013
Monthly perspectives FTSE, DAX, S&P, DOW
A look at the monthly charts for major indices, LONG TERM. Looking toppy ..but as they are longer term, may take a month or so to play out. UNLESS they break significantly higher then odds are that the next BIG move is down, whether it be correction or END of this BULL MARKET from 2009.
A look at the charts shows some bearish divergences starting to show which in the past have all signalled start to significant down moves.
FTSE
S&P 500
A look at the charts shows some bearish divergences starting to show which in the past have all signalled start to significant down moves.
FTSE
DAX
S&P 500
DOW
Tuesday, April 16, 2013
Correction finally here? Fibonacci retraces
Have the equity markets finally reached a short term peak?
Look at weekly charts
FTSE
showing previous corrections related to Fibonacci retracements
So if a correction has started for worldwide indices can probably expect FTSE to find a low either at 38.2 % retrace 6125 or 61.8 % 5955 (approx)
now adding on some trend lines
DOW weekly
Monday, March 18, 2013
Perspective
The TREND is UP for most things, despite today's drop. Is today's drop the start of more significant correction? Or a bear trap?
FTSE
Sell support?or BUY support?
FTSE
Sell support?or BUY support?
Tuesday, March 12, 2013
Commodities ready to make their move?
Commodities may be bottoming
Gold daily
near support
in down trend still but at bottom of channel and horizontal support close by 1550
Copper daily
testing lower boundary of triangle (see weekly chart)
rebound to 377? 7%
Copper weekly
Silver daily
closer to support
at bottom of down channel
positive divergence RSI price
Gold daily
near support
in down trend still but at bottom of channel and horizontal support close by 1550
Gold weekly
testing lower boundary of triangle (see weekly chart)
rebound to 377? 7%
Copper weekly
Silver daily
closer to support
at bottom of down channel
positive divergence RSI price
Tuesday, March 5, 2013
Finally a break out to the upside imminent
Are the markets poised to break higher..finally?
The consolidation has been longer than expected BUT
the downside has been limited
the weak longs are probably shaken out
the bears have been given some hope
so NOW the market may be ready for new highs
FTSE 4 hr chart
A break above 6426 and holding should mean a new high for the FTSE.
and eventually possible all time high
AAPL
still not getting any love and hatred increasing. 406 next support after that 380
Yesterday finally filled a gap
Despite AAPL falling NDX has been holding well, if/when AAPL rallies NDX has a bull flag target of 2900
Quick look at NDX
The consolidation has been longer than expected BUT
the downside has been limited
the weak longs are probably shaken out
the bears have been given some hope
so NOW the market may be ready for new highs
FTSE 4 hr chart
A break above 6426 and holding should mean a new high for the FTSE.
and eventually possible all time high
DAX
Similar to FTSE long consolidation after rally from November. Again, despite only giving back max 4% the sentiment has been increasingly bearish.
Next hurdle for DAX is 7865
Euro vs USD
All currencies have been weak vs the USD recently. On the Euro daily chart it looks like some positive divergence creeping in. Euro may be due for a rally, and conversely the dollar due a fall?
still not getting any love and hatred increasing. 406 next support after that 380
Yesterday finally filled a gap
Despite AAPL falling NDX has been holding well, if/when AAPL rallies NDX has a bull flag target of 2900
Quick look at NDX
Tuesday, February 26, 2013
Rally not finished ..YET
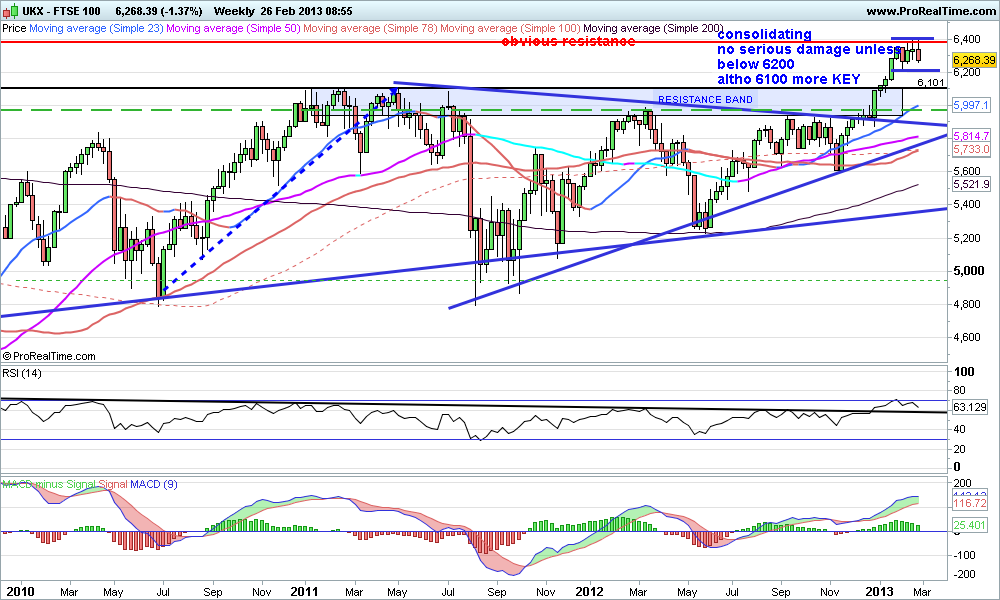
Even though it feels like it yesterday's falls in equity markets (blamed on various things..Italian elections, US FISCAL CLIFF part II! etc etc) probably is NOT the beginning of a sustained bear market move.
Sentiment has reversed quickly , with the FEAR factor rising rapidly..NOT normally the way BEAR mkts start
Looking at the weekly charts
DAX
Weekly chart
Hovering at support 7570/7580
would need to break that significantly for more sustained correction
trend line support and horizontal support seen better on DAILY chart
FTSE weekly
Daily chart
Friday, February 22, 2013
Bells are NOT rung at market tops
The press is turning bearish.
Is it a TOP?
Very unlikely..
Correction likely, but with all the press calling for a SLIDE the risk is more to the upside the the downside
Is it a TOP?
Very unlikely..
Correction likely, but with all the press calling for a SLIDE the risk is more to the upside the the downside
Wednesday, February 20, 2013
DAX
The DAX has been off everyone's radar on last few weeks..
Under performing, why? Well it had a big run up from NOV lows 13%, and despite FEELING bearish in last few weeks, has only retraced 4%.
Support found around 7570
Has rallied 200 points in 2 days so short term may pull back.
Longer term consolidation looks to be over and ready for challenge on new highs
Under performing, why? Well it had a big run up from NOV lows 13%, and despite FEELING bearish in last few weeks, has only retraced 4%.
Support found around 7570
Has rallied 200 points in 2 days so short term may pull back.
Longer term consolidation looks to be over and ready for challenge on new highs
FTSE Next stage of rally
Looks like the consolidation has finished..now where
FTSE daily
found support at mid line of the up channel
Looks like should test upper boundary @ 6456 (approx)
TREND still UP
FTSE daily
found support at mid line of the up channel
Looks like should test upper boundary @ 6456 (approx)
TREND still UP
FTSE weekly
At resistance 6380. next target 6550
ALL time high looks like it will be tested, not necessarily bested.
Wednesday, February 13, 2013
Consolidation over?
DAX and FTSE have been consolidating after rally from November lows. Is the consolidation finished?
It's looking increasingly like it. Markets have given very little back; bears will be getting nervous, and buyers seem to be pressing. The next rally could be the end of this run, but with quite a lot of bears around it may run further than expected.
FTSE
Looks like it has respected the channel it is in and bounced off the mid point
rally should head towards upper boundary 6426
DAX
seems to have found support at 7570
above 7726 should accelerate as bears give up
target minimum the highs..7860 though probably higher
NDX Nasdaq 100
After the big gap up traded in range 2700 /2760
very dependent on AAPL
BUT has broken above that range
expect support 2750.2760
rally should carry eventually to 2890 or higher
Use AAPL weakness to buy dips!!
AAPL
Stiff resistance at 500
probably range bound 440 to 500
DJIA
high level consolidation
everyone "expecting " correction
so probability is it heads higher..
a break above 14200 may accelerate
Wednesday, February 6, 2013
Can't see the wood for the trees!
Imagine looking at an oil painting from a distance of a couple of inches? You would not see much of the whole picture, a few splodges of paint.
Sometime charts can be like that especially if one is looking at them day in day out. So at times it is best to STAND back so one can see the whole picture. That is look at the LONGER time frames, like the Monthly and Weekly charts. Then it may become clearer what that picture is telling one!
Monthly Charts below
Pretty self explanatory
AUDUSD
FTSE
Sometime charts can be like that especially if one is looking at them day in day out. So at times it is best to STAND back so one can see the whole picture. That is look at the LONGER time frames, like the Monthly and Weekly charts. Then it may become clearer what that picture is telling one!
Monthly Charts below
Pretty self explanatory
AUDUSD
CABLE
EURUSD
FTSE
DAX
DJIA
Monday, February 4, 2013
FTSE Neg divergence on DAILY
FTSE
After a strong run seems the "pause" may have begun last week. On the daily chart it looks like some negative divergence between price and RSI. If we get a new high, with no corresponding high in RSI, will look for shorts but bearing in mind the trend is still up and the fall should just be a correction of the move up.
Min correction 6280
deeper correction could target 6170
After a strong run seems the "pause" may have begun last week. On the daily chart it looks like some negative divergence between price and RSI. If we get a new high, with no corresponding high in RSI, will look for shorts but bearing in mind the trend is still up and the fall should just be a correction of the move up.
Min correction 6280
deeper correction could target 6170
Wednesday, January 30, 2013
Time for a break?
markets have been steadily grinding up. So far no panic buying suggestive of a capitulation top. However some markets look over extended for now.
FTSE daily, 4 hr and 2 hr
Looking at various time frames they all seem to be overbought. Ideally a retrace would be good for refreshing the trend up. However it may be the FTSE trades flat rather than trading down significantly.
3 main options
1. a correction within the up channel, first target the mid line of the up channel (dashed line)
2. trade sideways until overbought conditions are relieved.
3. market continues up and more extended, but would lead to a more dramatic correction, espcially of the rally is sharp and in "blow off" style.
Thursday, January 17, 2013
Week 3 ..CONSOLIDATION
January week 3.
Markets have consolidated the recent gains, most notably the DAX, which had a month of up days with little correction. FTSE flirting with 6100/6070 as support. EURO broke through 1.33 and looks to be back testing that level, holding above 1.325. Cable notable under performer clinging to 1.60 level.
S&P very tight range 1465/1473
Oil, gold and silver have also held their rallies, as copper consolidates
OPEX week so not expecting major change this week.
AAPL trading dominated by emotions. $500 key PSYCHOLOGICAL level was broken mid week, and subsequently recovered. The POSITIVE divergence on the DAILY chart continues and it is possible that the drop below $500 has now cleared out weak hands and "emotional " selling. AAPL has also caused to NDX to under perform so a turnaround should be reflected many times in the NDX
CHARTS
FTSE Daily
May still be a move down but would not expect 6000 to be reached, more likely 6050 if anything
More likely scenario is a break higher once this consolidation is finished with. Targeting 6400
DAX daily
DAX also consolidating (pink box) after the strong rally from November low.(light blue arrow)
Also looks like it will be on the way to new highs once this is over.
Possible for a scary move down MAX 7560 (in the scheme of things not that big a fall, but would shake out any weak hands). More likely we have seen the extent of this consolidation, and a break above 7800 , targets 8000 and maybe higher.
EURO daily
The EURUSD looks to be headed higher 1.35 first target. Projected path pull back and then rally further towards 1.40 level, which SHOULD coincide with new highs in equities and a push higher in commodities.
Cable daily chart
1.60 looked to be key level..but like AAPL probably more psychological with a lot of stops just below. More important should be 1,5970
tentative EW labeling ! Maybe we are poised for wave iii up. Target 1.63 and beyond
A drop below 1.5830 changes things
AAPL daily
NDX daily chart
The GAP up has not been filled (BULLISH)
looks to be forming BULL flag between 2710 and 2750
A sustained break above 2750 could target 2890 (measured move)
NDX weekly chart
Chart is pretty self explanatory
a sustained break above the rectangle and we could see similar move to August 2012
Tuesday, January 15, 2013
Subscribe to:
Posts (Atom)