Quotes

Look back over the past, with its changing empires that rose and fell, and you can foresee the future too.

— Marcus Aurelius

Followers

Search This Blog

Tuesday, November 20, 2018

The week begins with a BANG

At a crossroads now, looks like the bears have started the week in force..
BUT  ...it needs to follow through for the bear scenario to play out

Dow at a key level, above could be very bullish and below very bearish
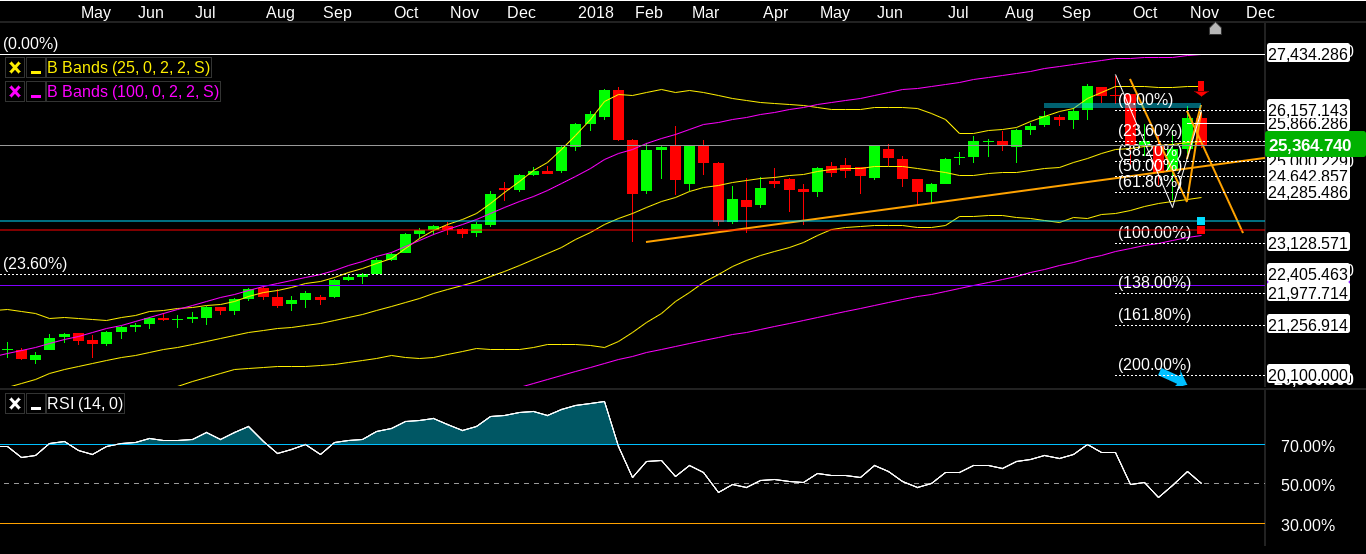
weekly chart shows that now breaking below the trend line again - this tome could be decisive -despite it being a holiday week in the US (Thanksgiving).


in favour of the BULL

seasonality (Santa Claus rally)
still above trend line despite the brief break below


in favour of the BEARS

break below trend line - warning signal
negative divergence on longer term charts
all the talk on financial media is of "buy the dip" - especially CNBC and ironically the "Santa" rally
The reasons for the fall in October are still there:

1. rising rates
2. Future outlook for major companies uncertain
3. trade wear worries
4. European markets have been relatively weak


If follow through to the downside this week then the first test will be the October low;  At present it looks like the DOW could get to 23500-minimum - can change depending on the near term behaviour.

NASDAQ monthly
some perspective...
"What goes up must come down " - the question is "HOW far?"


Friday, November 16, 2018

Battle at the line - a look at the DJI

markets are still volatile with large intra-day moves
It seems that buyers are stepping in on the falls and sellers are selling the rallies..

At some point one side will dominate...

at the moment based on charts - the bears have the upper hand..

Look at the DOW first.
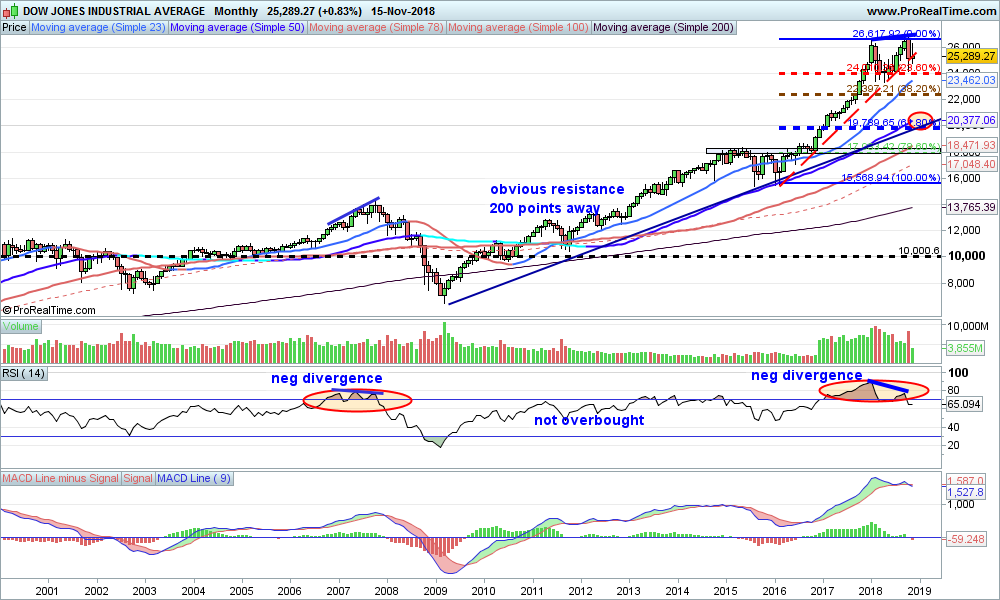
Monthly chart gives perspective...
It shows the extend of the rally.

At a minimum it should correct the rally from 2016, and looking at Fibonacci levels, 23.8 % would be around 24k.
38.2 % would be 22500, or thereabouts
61.8 % level is 19700  (BIG correction) - this level may tie in with a correction of the rally from 2008 i.e. a larger correction.

IF this is a correction of the rally from 2008 (about 7k to 27k) the corresponding fib levels would be:
23.8 % - c 22k
38.2 % 19k
61.8 % 14300  -

Notice that 61.8 % level of the smaller correction is similar to the  38.2 % level of the larger correction (KEEP 19k in mind)

ALSO notice the negative divergences between price and RSI which is a clue that a decline is on the cards


Zooming in to the weekly; shows key levels a bit clearer


Finally even shorter term , the DOW daily

This shows the battle between buyers and sellers at that trend line, with a break and then rally, and again another break.
The next post will be about the psychology of these breaks of trend, ANIMAL BEHAVIOUR - (or if you're precious about the human race , HUMAN behaviour)


Thursday, November 15, 2018

Apple succumbs to gravity

Quick look at Apple Inc.

Huge stock for the market due to it's weighting in indices and as a company; a bell-weather for tech stocks.

What does the recent fall do to prospects for the future?
The monthly chart puts it into perspective - a HUGE rally, which is now correcting BIG question is where to?


Looking at the weekly for a closer look
Highlighted areas are horizontal price supports
Close to the first one and the up trend line, (the steeper one).  This is probably good for a short term bounce.


Now zoom in to the daily
A little more to the downside to really test the horizontal support at 180 approximately


Wednesday, November 14, 2018

13 - unlucky for some -

Crude oil.

13 days down

"What goes up must go down" and vice-versa.

When will it bounce?


The chart shows the steep down trend which is still in force...
BUT conditions look oversold.

Trading is all about probability..

Chances are increasing that there will be a snap back...at least to test the down tend.

I would expect then another test of the lows and possibly a lower low, but watch the RSI - if it fails to make a new low probability then increases for a more sustained rally.

Until then nimble trading ..


Tuesday, November 13, 2018

That didn't last long..

The post mid term election rally - just fizzled out.  Where to now? Looks like we consolidated the initial move down with a 6-8 day rally (depending on the market you look at), and now markets are in the next leg down...

1. will this be a 3rd wave down?(longest and strongest)
2 is this still correcting the trend up since  2008


As seen from the chart above - monthly DOW - the rally from 2008 to 2018 was huge roughly 20,000 points.  It is not inconceivable to correct to FIB levels...we are close to 23.8  and on the chart the blue shaded area is the 38.2 % level...19200 (approx).

I like looking at the long term as it cuts out the daily "noise".

Talking heads (CNBC) still talking about how it's right to buy the market here..gut feeling is that they will be proved wrong... in the short to medium term..

Obviously it all depends on the time frame one is looking at.

DOW weekly shows the 2 week bear flag - measurement suggests minimum 23200 as a target as indicated on the chart.


Thursday, November 8, 2018

Crude oil 3 charts


Monthly chart (top) shows a LONG term view.  Longer term oil is still in a down trend from it's peak at around 200 USD per barrel.

Weekly chart (middle) shows that price is approaching a support zone, previous support and resistance area around the 58 USD mark.
Not oversold yet on weekly.

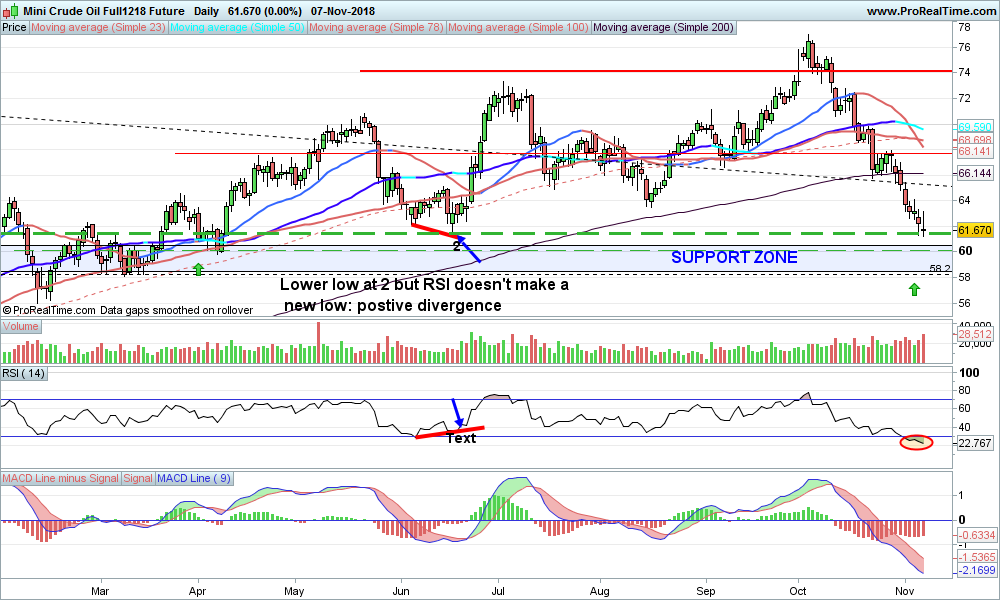
Daily chart:  shows the support zone more clearly.  Looking oversold but no divergence between RSI and price.
See below for an example of positive divergence between price and RSI


Post mid-terms

Wow - so the result was more or less what was predicted in the polls, and the markets had a HUGE rally.

Since the low of 2 weeks ago the DJI is up 2000 points.

Are we on our way to new highs?

Looking at the charts.

DJI - Daily chart with possible Elliott Wave count (BULLISH MEDIUM TERM)


Notes : Elliott Waves (click here for more information https://bullwaves.org/elliott-wave-course-define-dominant-trend-using-elliott-wave)
Elliott noticed that markets move in impulses (5 waves) followed by corrective waves (3 waves)

There can always be different wave counts (alternatives) - but it CAN give a clue as to market direction

so if we are in a final V wave up for this bull market to NEW all time highs, and we have had wave i and ii, then we are in wave iii.  The recent 2000 point rally COULD be the start of wave i of iii of 5, may not be finished

when it does finish then we should get a wave ii down before the wave iii of V.

Wave 2's can be deep which may suck in bears thinking that this is the next leg down.
(THAT COULD BE AN ALTERNATE COUNT)

Looking at the DAX in Germany (and FTSE similar);  despite the HUGE rally in the US the market remains subdued.  This could change with a break above 11800 which would invalidate the Head and Shoulders formation (previous post)

This may tie in with a fall in US markets- whatever there is a disconnect at the moment..but a fall in US could continue the correction ...
Alt: US continues to rally and DAX breaks upwards

Monday, November 5, 2018

Big week ahead -

This week will be full of the mid term elections in the USA voting on Tuesday.

News can move markets short term - but generally speaking unless it's a bolt from the blue (KCTM, Lehman  etc) the charts can help to navigate the turbulent waters, keep an eye on resistance and support.

The chart below shows the DOW daily and a BULLISH set up from an Elliott Wave perspective.

I'm no expert but I know that an impulse is 6 waves which is then followed by a 3 wave corrective. This is the simple explanation as waves can sub-divide.


Bullish:  we have finished wave 3 and the recent fall has been a correction i.e. wave 4 and now we are in the final wave 5 up.  The rally from the lows may be a wave 1 and we are now in wave 2 down..wave 2 down can be quite deep - it will suck in the bears thinking this is the start fo a new bear market (if it break the recent low - it MAY BE).

If we hold then we should have a good rally which will eventually make a new all time high.

Be nimble this week, don't get married to a view or position.  It will be volatile - and could offer some good opportunities if we get large moves up or down

Thursday, November 1, 2018

A look at the DAX

So yesterday was a strong rally day - have markets turned the corner.

All the talking heads were very bullish and still talking about bottoms (market ones!)

- that to me is a warning that it ain't over yet.

After 11 or 12 days down - it is NORMAL to get a counter trend  - 2-3 days or sometimes an extended correction 7 days..

Bear market rallies are VICIOUS - as real buyers step in and short sellers also cover positions


Remember VOLATILITY will continue, there will be wild moves, you have to be NIMBLE.  
Most traders lose money in bear markets - due to the volatility

DAX rising wedge - tends to be a bearish formation


at the moment midday London time, it looks like a failed break out or throw-over..but that could change during the next 3-4 hours.  

Key level - if break to downside 11400 , probability of down trend continuing increases.
Conversely follow through above 11575  favours 11700-11780 (test of neckline of heand and shoulders**)

**  Remember if patterns fail the move can be dramatic in the opposite direction, i.e. if a head and shoulders top fails a sizeable rally would probably occur

Probably/probability/  looking at charts is not predicting moves but working out probabilities of certain events happening - sometimes more than 2 options may be seen


Wednesday, October 31, 2018

Break out


DOW:  finally a break??


Yesterday's rally may have broken the wedge to the upside.

Now it needs follow through, a failure here would probably mean trading back into the wedge and testing the lows again.  Volatility still persists.

Gut feel:  still didn't seem to be enough pessimism for a bottom - we'll see.
Rallies like yesterday's can be self fulfilling as short covering increases.
The market was DUE a bounce - so expected.

At moment many markets are near resistance.
Good area to try a short - with a tight stop. for a short term trade

If it does follow through on volume, but the dips.
Initial targets:  25300, 25800  - on the upside.


Tuesday, October 30, 2018

More volatility - roller-coaster ride in US yesterday

As per yesterday's post (Note 3 on the DOW) markets were trading with more volatility, DOW has an intraday swing of 900 points - up strongly in the morning collapse in the afternoon and finally recovery at the close.

Was that the wash out for the move down? 

Is it rally time?


Evidence for end of down move:
1.  wedge broke to the downside and quickly recovered
2 Possible positive divergence RSI and price (still not confirmed)

However:
1 the recovery to me seemed to be short covering and dip buying
2  on shorter time frames the price has hot a new low and so has the RSI
3. Price is STILL contained in the wedge

So I think more volatility and another test of the wedge boundary (lower)

Needs a break above the top boundary to signal that the down move may be over

Monday, October 29, 2018

NO breaks yet DOW - but close

Looking at the DOW;

2 hour chart

DOW 2 hours
1.  Still contained within falling wedge.  Low boundary 24k  Top boundary around 25k, then 25400 (key)
2.  watch for false breaks either way
3 as the wedge progresses trade will be more volatile - battle between sellers and buyers intensifies

Other markets are similar
DAX daily


1. Daily chart show large head and shoulders  (click link to read about this pattern)(bearish) pattern neckline around 11720, target 10200
2 The neckline was broken, and now it looks like a break above 10370 will be a rally to test that level 11721
3. A break of a head and shoulders neck line is usually retested

DAX 2 hours


1.  Looks like 10370 being tested ..next key level 10430

Markets can see a decent  rally and still not break the longer term bear trend..

warning signs that down trend has, breaking key levels on the upside  finished 

Friday, October 26, 2018

DOW key level 24,000

Watching the DOW - again the markets selling off; The talking heads on CNBC - always bullish - are like deer in the headlights, they do not know what to say or do.

They are still looking for a rally - I think we are getting close but still a final shake out in the cards.  And a key level is 24k.  On the monthly we can see that the steep up trend's lower boundary is at this level (give or take a few hundred points).


DOW MONTHLY


1 . A significant break below 24 k would indicate a large correction is under way
2. a test and hold of this level will more than likely see new highs

Why do I think we may be close to a rally?  Look at the daily chart.


1. There seems to be a positive divergence forming
2. It looks like a falling wedge  Which has bullish implications (click on link for explanation from stockcharts.com)
3.  Falling wedges tend to have a false break out in the direction of the wedge, which if it happens will be the final wash out before a rally

Thursday short covering - quick post

Well everyone was bullish today - the DOW up 500 points at one stage... has the short term down trend changed?


Not according to my charts

DOW 2 HOURS

What can be seen in the chart

1. Despite the rally today the DOWN TREND is still intact
2.  I think a break above 25300 would be a signal that the down trend has finished
3.  A break of 24520  the very short ascending channel/wedge from the lows, will see new lows target 24k minimum

4.  It feels like the move is coming to an end - see previous post for the possible postive divergence set up


Thursday, October 25, 2018

Long time - a look at the DOW

It's been a while , the main reason being that the market has been in a low volatility long term rally but in the last 2 weeks all has changed.

Up to 2 weeks ago the majority were all expecting new highs for the US markets, me included, however since then bullish investors have had a wake up call; the buy and hold scenario may be changing - MAYBE.  Volatility is great if you are nimble.

What do the charts show - remembering that a chart fo a stock, market, commodity and any other trade able instrument shows the underlying behaviour of market participants at any one time.
They don't predict the future nut they CAN tell you how these investors behaved at previous price levels in the past, which can help to formulate a plan for the future direction - remembering that in markets there can always be more than one option so an open mind is essential - don't get welded to your view ! 

DOW:  headline index - makes all the news!
Looking at the LONG term...steeping back
DOW MONTHLY
What does it show:

1.  the market has been in an uptrend since 2008 (financial crisis) - 10 years
2. After a minor correction in late 2015 early 2016 the rally resumed at a steeper angle, buyers more aggressive
3 The recent fall is testing the accelerated up-trend line  KEY level.  Hold here and a rally to new highs is likely.
4.  A BREAK below here could see downside to the long term trend line.

Remember this is a long term chart ..good to look at different time frames to get ideas about long term perspectives.


DOW WEEKLY
This shows a closer look at the longer term. It clearly shows that 24000 is the key level.  However in my experience it will likely overshoot a little..the key here will be if it rebounds quickly...

DOW DAILY

POINTS

1. Possible positive divergence on daily chart between price and RSI - not confirmed yet
2. Seems to coincide with the steeper uptrend

So at the moment I would say that the market is close to finding support at around 24000, with a possible overshoot to below but a quick recovery.

Then a re-test of the low before the rally resumes could tie in with after elections in USA.

CAVEAT:  this is just one scenario but IMHO it's all about probabilities and behaviour.  A word of warning - if you use CNBC take it with a pinch of salt - entertainment.

Next post : looking at smaller time frames


Tuesday, September 22, 2015

A year on (more or less)....

S&P cash index and Nasdaq 100 cash

Classic break of bearish rising wedge?

Time will tell.

Small short now
Add to short on retest of broken trend line
if falls off the cliff look at short term charts for short-able bounces


Friday, September 5, 2014

Now back in Blighty..

But this looks like could be in Spain

Tuesday, December 3, 2013

DAX correction imminent?

Daily chart may be turning..if so what does WEEKLY look like...................


When turn comes can correct quite a bit and not even dent weekly up trend..


Monday, November 25, 2013

No change in UPTREND ..YET.but some warning signs?

DAX

#New all time high !
BUT ..

FTSE seems to be lagging or is it LEADING??  could be froming a bull falg..but surprising with DAX at ATH it hasn't accelerated UP..as yet...

INSIDER selling seems to be picking up over last few weeks..sells about 2 to 3 times more than buys
Data from here  http://j3sg.com/

Gap up open today..maybe  some PANIC buying finally coming in ? Sign of retail feeling left out?

Charts

DAX


FTSE

Bull flag or topping? Weekly chart may give some clues?


FTSE WEEKLY

Not much clue here still looks like 2 possibles bull flag or double top.. a decisive break above would mor elikely mean NEW ATH as well..

How about monthly?


 FTSE MONTHLY

Monthly LOOKS like a top and possibly important one forming, HOWEVER a MONTHLY chart is LONG term.. best to keep it in back of mind...
RSI starting to show some neg divergence..
Previous tops took over 8 months to form..whipsaw and false breaks up and down.


DAX MONTHLY

Thrown in for good measure..
Broken out..
accelerating up..
Only caution is RSI starting to enter overbought, but would suggest at moment no change in trend.


Total Pageviews