Quotes

Look back over the past, with its changing empires that rose and fell, and you can foresee the future too.

— Marcus Aurelius

Followers

Search This Blog

Thursday, December 20, 2018

That was fun! Dow closing in on 22300 target (Dax 10200)

There are benefits of not having huge positions on a day like today;

less stress
more choice
small positions means more flexibility for volatility

Dow looks to be closing in on 22300 target
see what happens tomorrow


DAX  10200?  Head and shoulders target
still stepping down to that target


Saturday is a full moon - from experience could be a wild day and a possible low point for the market - especially with a short trading week next.
Moon cycles and Stocks - a lot of research out there
or here
Having studied Zoology (and in particular ethology) I am amazed that people doubt the influence of the moon (and sun) on behaviour - after all many animals have behaviours dictated by moon cycles and they are the obvious observable behaviours (mating etc) - but possibly many more as well.  Humans are ANIMALS!

Wednesday, December 19, 2018

Waiting for the Fed...long day ahead

While waiting for the decision ahead - LONG day - there has been a lot of coverage of the decline since October.  So where is the market?

Is it the start of a long term (Primary) bear market?
Is it a short term correction? (secondary movement - counter Primary trend)

Each Primary trend (up or down) has 3 stages

1. Accumulation (Bull)  Distribution (Bear)

2. Large move

3. Exuberance (Bull) or despair (Bear)

Just going to look at the change from Bull to Bear as the market has been rallying since 2008 
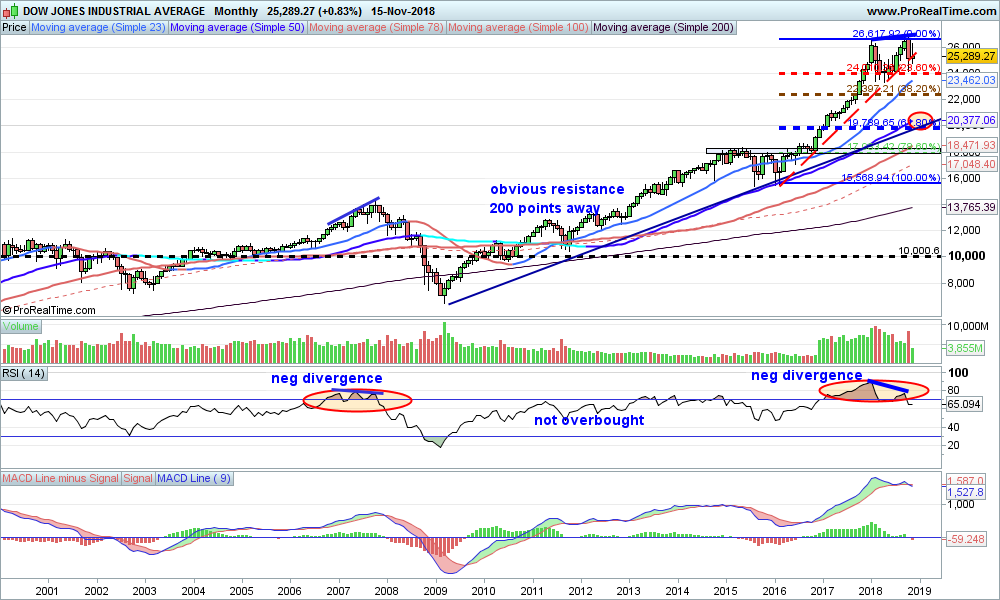
Looking at DOW (headline index) - up over 300% since 2008
The chart shows the (possible 3 stages)

So now it may be the start of the BEAR -
Probably seen or seeing stage 1

1 Distribution
  • Smart money notices changes in business climate and start selling stocks
  • Public still heavily involved and buying stocks (this is when the man on the street starts giving advice on buying stocks)
  • However smart money tends to be larger and stocks start to fall
  • Rallies will be strong and give confidence to bulls that the bull market is still strong
  • however the rally should not exceed the previous high
Chart show monthly Dow Industrial
The high in February 2018 looks like the exuberance by the public
Reaction high in September looks like the resumption of the bull market ( all forecasts were for new highs and Dow targets of 30,000)


to be continued as the market plays out...


Crude oil

No bottom yet - despite quite oversold conditions
What do the charts say?

Weekly chart - what does it say?

Oversold - BUT price and RSI going to new lows - no divergence yet so selling pressure still evident
Next major support - shaded area, with possible overshoot
If that doesn't hold crude is headed lower


What about shorter time frames?

Crude oil daily

Getting close to oversold
POSSIBLE positive divergence setting up - as a new low with RSI looking like it will not form a new low


Crude 2 hour chart
Stepping down the stairs
Nice bear flags on the move down
Looks like at least one more setting up


Worth keeping eye on especially if it gets to the support highlighted (set alert for 42.9)
once the down move is finished - there should be a decent rally (corrective)

Monday, December 17, 2018

Market correction of Trump rally or 2008 rally?

The markets are obviously correcting and have been since October.

The US markets have outperformed the rest of the world.

European markets seem to be in bear moves since around May 2018.

So the BIG question is - referring to US markets and the DOW in particular;

What exactly are the markets correcting?

Since 2008 there has been a bull market

Within the bull market there has been a correction leading into 2016 , and a rally since then - the " Trump" rally.

A correction in early 2018 and a rally to new highs

DOW monthly chart below

The box outlines the Trump rally
Show a double top
The rally has retraced to the 23.8 % Fibonacci level, this is usually the minmum retrace
Odd are that it will test the 38.2 % level , 22300 approx.
Why?  Too many investors are still in the BUY the Dip mentality
The market has changed since the first correction on 2018
There are genuine concerns about a slowing economy in 2019 which doesn't support valuations seen earlier in 2018 - whether recent falls have made these fairer is still open to debate - so UNCERTAINTY - never good for markets
Trade wars - more UNCERTAINTY


What if the correction is actually of the whole rally from 2008 ?

The market has rallied over 300 % since then
A correction of that would be more severe (and still be in a SECULAR BULL market)
DOW chart below showing Fibonacci retracement levels
Coincidence - 23.8 % retrace is almost same as the 38.2 % retrace shown in first chart (22300)
If the correction is for the whole 2008 rally, there could be a lot of pain ahead. 
In Elliott Wave terms the whole rally from 2008 could be a wave 3 (typically the largest and longest), with the fall in February as a smaller wave 4 and then rally to new highs for smaller 5 , which completes wave 3.

All that aside , favour a fall to 22300 unless the markets turn around PRONTO!

Talking heads (CNBC) keep talking about how the market is good value - good contra-indicator.

CAVEAT:  Medium term bearish scenario may change if there is some deal with China, the FED LOWERS rates instead of raising.


Friday, December 14, 2018

Sentiment


Again this week CNBC watched by many (including the POTUS) are constantly talking about "finding bottoms"

Too many "bottom pickers" and "buy the dip"

Major US indices look like testing the pierced bottoms last week, and ,more than likely hitting new lows for this move.
The rally from the circled area looks corrective and losing steam i.e. not heading to the top of that range looks very bearish.

I would not be surprised to see a wash out next week ahead of Christmas, and THEN maybe we find a tradeable low.


Cable - broke support

So the cable set up seems to be playing out.

short with stop above 1.2720
it broke support and then tested that support which now look like resistance. Target medium term 1.1875 (triangle measurement)
lower  stop after today's trading

Updated chart below


Cable 2 hours


Previous post below:
Cable  looks to have broken an important support at 1.2670 (ish).
Wait for either a retest in case it's a false break or selling momentum increases to sell


Obviously a lot of Brexit news (not for the faint-hearted) but measured price target if the selling continues will be around 1.1870

Cable daily chart


Wednesday, December 12, 2018

FTSE triangle

Has the FTSE broken out of the triangle to the upside?

Triangles CAN be reversal patterns as well as continuation patterns, however continuation patterns are much more common.

4 hour chart

Shows the longer term support which was broken.
The triangle with potential break (or false break to the upside)

If it's a break to the upside the triangle will be a reversal pattern (rare)
If it's a false break - should reverse fairly soon and retrace the whole move up

Interestingly normally a break below long term support - usually sees a re-test of that support - so this move up may be doing that..

Key is getting back above that support.

Anything less increases the chances that the down move has not finished.


Tuesday, December 11, 2018

FTSE triangle update

Looks like there was a false break out to the upside of the triangle  FTSE traded as high as 6858

That probably stopped out a lot of shorts and sucked in longs playing the break out..

That's what bear market rallies do

All reverse in the afternoon with the DOW giving back all the morning's rally ( again a Trump hot air tweet helping to push it higher)  and more..

Interesting to see the close


FTSE - short term - watch the triangle

The FTSE is an interesting market to watch in terms of technical analysis, especially with the BREXIT "news"

Lots of news  - BUT "news doesn't matter"
 One of the principles of technical analysis whether its normal bar charts or candlesticks is:
"The “what” (price action) is more important than the “why” (news, earnings, and so on)."

Short term the FTSE is forming a symmetrical triangle
This is usually a CONTINUATION pattern i.e. when it completes the preceding trend will re-assert itself  - in this case DOWN
A break above the top boundary will signal that the trend may be changing 

 Caveat:  beware of false break outs both sides; they should happen on increasing volume and usually better to wait for a confirmation with the next bar/candlestick of price action to avoid whip-saw.


Monday, December 10, 2018

Turnaround Monday?

Big turnaround on Monday 

Is that it for the downside?

signs of a rally - the market found support at the bottom of it's trading range.  And a 

Caveat: it did pierce support  so might be a warning sign.
Dow 2 hour chart
No break of down trend (yet)
Some positive divergence
Looks like 24750 could be touched and still be in down trend
A break above 24750 may be sign of bigger and longer rally - countertrend or nw bullish move


DOW daily chart

Clear hammer candlestick on the daily, which is a bullish reversal.  Clearly shows the previous support (look left) being pierced.
Hammer candlestick can be bullish but:
"𝙒𝙝𝙞𝙡𝙚 𝙩𝙝𝙞𝙨 𝙢𝙖𝙮 𝙨𝙚𝙚𝙢 𝙚𝙣𝙤𝙪𝙜𝙝 𝙩𝙤 𝙖𝙘𝙩 𝙤𝙣, 𝙝𝙖𝙢𝙢𝙚𝙧𝙨 𝙧𝙚𝙦𝙪𝙞𝙧𝙚 𝙛𝙪𝙧𝙩𝙝𝙚𝙧 𝙗𝙪𝙡𝙡𝙞𝙨𝙝 𝙘𝙤𝙣𝙛𝙞𝙧𝙢𝙖𝙩𝙞𝙤𝙣. 𝙏𝙝𝙚 𝙡𝙤𝙬 𝙤𝙛 𝙩𝙝𝙚 𝙝𝙖𝙢𝙢𝙚𝙧 𝙨𝙝𝙤𝙬𝙨 𝙩𝙝𝙖𝙩 𝙥𝙡𝙚𝙣𝙩𝙮 𝙤𝙛 𝙨𝙚𝙡𝙡𝙚𝙧𝙨 𝙧𝙚𝙢𝙖𝙞𝙣. 𝙁𝙪𝙧𝙩𝙝𝙚𝙧 𝙗𝙪𝙮𝙞𝙣𝙜 𝙥𝙧𝙚𝙨𝙨𝙪𝙧𝙚, 𝙖𝙣𝙙 𝙥𝙧𝙚𝙛𝙚𝙧𝙖𝙗𝙡𝙮 𝙤𝙣 𝙚𝙭𝙥𝙖𝙣𝙙𝙞𝙣𝙜 𝙫𝙤𝙡𝙪𝙢𝙚, 𝙞𝙨 𝙣𝙚𝙚𝙙𝙚𝙙 𝙗𝙚𝙛𝙤𝙧𝙚 𝙖𝙘𝙩𝙞𝙣𝙜. 𝙎𝙪𝙘𝙝 𝙘𝙤𝙣𝙛𝙞𝙧𝙢𝙖𝙩𝙞𝙤𝙣 𝙘𝙤𝙪𝙡𝙙 𝙘𝙤𝙢𝙚 𝙛𝙧𝙤𝙢 𝙖 𝙜𝙖𝙥 𝙪𝙥 𝙤𝙧 𝙡𝙤𝙣𝙜 𝙬𝙝𝙞𝙩𝙚 𝙘𝙖𝙣𝙙𝙡𝙚𝙨𝙩𝙞𝙘𝙠"
So tomorrow should see follow through to the upside to confirm and volume should increase.
If this fails to happen, likelihood increases of sharp move down to previously mentioned levels 22k Dow.


Monday mini-musings

DOW daily

just supports and resistance
Triangle still in play - near the bottom of this - so if nimble can buy with a stop


Caution : if it breaks support  - could be fast move down
Also this is the third test of support - more inclined to sell short  on a rally -

If it stays in the triangle , may head to upper boundary
Bias: still down


Saturday, December 8, 2018

Father Christmas MIA?

So far the "seasonal" Christmas rally hasn't materialised, and Father Christmas seems to have gone MIA as far as stock markets are concerned.

However there is still time for bears and bulls to be happy with their Christmas presents!

Looking at the charts:

DJI  daily 
The action is still in the large triangle (with a sloping upper boundary - leaning towards bearish)
Great for traders playing the range
Bear market rallies are vicious "in the bear market that began in 2007, stocks staged 12 rallies of 5% or more, with four of the 12 logging gains of more than 10%." - Kiplinger (for more statistics look at this page)
So as usual CNBC are still looking like headless chickens when the market heads south and when the rallies happen they are jubilant and bull happy.


What does it mean?

EVEN if the market is a long term BULL, there always is a correction - this is a normal process - and healthy for up trending markets.  However a 5-10 % correction after a 360 % rise since 2008 is probably not enough of a correction.

Monday will be interesting:

Gap down and target 23k or rally and stay in the triangle - time will tell.

DAX seems to be heading to the head n shoulders target (10200)
FTSE seems to be holding relatively well - this may be Brexit related with a crucial vote coming on Tuesday

So world markets seem to support more downside for the moment.

So bulls and bears can win.. a fall next week followed by a rally.

Longer term the markets may be signalling the end of the 2008 bull run.

SPREAD charts:

Sometimes good to look at spreads between different indices.

This is  DAX- NASDAQ 100  spread..

so at the extremes a play is Sell DAX and BUY NDX or vice-versa  looking for the spread to normalise.
At present it looks like Buying DAX and Selling NDX should be a profitable trade over the medium term, expecting the spread to expand again.


Thursday, December 6, 2018

Let's talk about bottoms

Here are a few sayings about bottoms

"Only monkeys pick bottoms"
" picking bottoms will give you smelly fingers"

Why ?  The usual CNBC talking heads are still spouting the bullish side...


" In the case of the Double Bottom Reversal, a significant downtrend of several months should be in place."
"Prior Trend: With any reversal pattern, there should be an existing trend to reverse. In the case of the Triple Bottom Reversal, a clear downtrend should precede the formation." 


DOW daily
Watch out below if that support breaks 
Triangle measured target is around 22100
Which sort of ties with the first target


DOW WEEKLY
Could be short term support around this "triple bottom" - just because everyone is looking at it - the buyers will not be strong hands
Next support is probably around 23050 (look left) 
Then 22000/21300


Wednesday, December 5, 2018

Markets take a turn for worse (if you're long)

So the "XiTrump" rally lasted all of one day.  See previous post here

What is the roadmap now?

What is the psychology of the market(s) ?

In words:
The Fed rally was explosive - however this was probably short covering and machine driven trading - this means NOT much SUPPORT for the market. 
The "XiTrump" rally was also a NEWS  driven rally - again these rallies don't give a lot of support to the market as they are too quick/

Explosive rallies like these tend to be characteristic of BEAR moves  so for the moment the DOWN trend since October remains in force.

So where to?  Short term I expect markets ti accelerate the move to the downside (today US markets closed) so maybe Thursday.  Reason being that they have spent a couple of weeks consolidating - corrective - so next leg down soon.

Targets remain the same from previous posts DOW 23200 DAX 10200 FTSE 6400 (? complicated with BREXIT )

If markets don't reach these then likelihood is selling is abating.

If markets reach these targets then what happens next will give clues to the next move.. RALLY or further DOWNSIDE.

Charts below of the DJI


Charts of DAX showing head and shoulders targets (notice coincides with long term up trend)


Looking forward to THURSDAY!

Tuesday, December 4, 2018

G(20) - whizz - friends again?


Some of the statements made by Trump after the G20

"If it happens it goes down as one of the largest deals ever made"  
“was an amazing and productive meeting with unlimited possibilities for both the United States and China”.
"amazing and productive." 
"a not yet agreed upon, but very substantial"

This is to be expected based on past form, and yesterday it continued regarding car tariffs.

So what have we had?

A rally based on Fed chairman Powell - back tracking - 
A rally based on a "truce" between China and USa in their trade war.

Turning on the TV to listen to CNBC the media machine is in full force pushing the bullish side.
Comments like " the Santa rally is here", " we've had the correction and now it's time to buy", "the worries about interest rates and trade wars have receded" - to me it seems everyone is bullish.

Look at the charts (a picture of the behaviour of all active participants in that instrument).

DOW JONES (headline index)
Monthly chart
Not much changed on the longer term - still showing negative divergence between price and RSI
Target price still there 23150 (approx) trendline support and horizontal support (look left)


Closer look
DOW weekly 
RSI not oversold
At a minimum expect it to test 23150 ish
behaviour then will give clues to next pathway
1.  a fall through there and this may be a full blown bear market
2 a hold there and rally may be sign that this is a correction and now on way to new highs

As always makrets are dynamic keep eye on levels and probabilities


Even closer look
DJI daily
So could be forming a triangle  - watch the boundaries
at present we are near the top so short - obviously a sustained break above would increase chances that this correction is over
A break below the lower boundary - and target comes onto play and maybe more


   Other thoughts

Everyone is expecting a santa rally into year end
Bull market is 10 years old
Earnings outlook for 2019 may be getting cloudy


Friday, November 30, 2018

"To subdue the enemy without fighting`is the supreme art of war." - Chinese philosopher Sun Tzu

G20 - weekend it's a CRAPSHOOT -a risky or uncertain matter.

full of news - will Trump and Xi agree to be friends?
(I put it in the vernacular form, as Trump speaks like this - and quite often in a very child-like form, which is probably why he appeals to half of the American people)


So  looking at the charts :
Dow Industrial  - (I'm not an expert in candlestick formations but do refer to a book I have dealing with Japanese Candlestick charting)
What can we see?

1.  In candlestick terms each of the highlighted moves has a long bullish candle, followed by a "spinning top" - a sign that buyers and sellers are evenly matched or indecisive.
2. Looking at the firs 2 highlighted patterns : these are called " Evening star" they usually occur at the top of a trend.
3.  This implies that the next big move will be down..HOWEVER as this weekend is a CRAPSHOOT - several scenarios can happen.

a.  A large gap and crap
b.  large gap up and continue
c.   large gap down and recover
d. large gap down and continue
e small range trade

"Do I feel lucky?' Well, do you, punk?" 


So...if you're feeling brave - take a position
If not flat is also a position - and there will be trades to do after the event.


Tuesday, November 27, 2018

Have the markets bottomed?

If you listen to CNBC then you would probably think that every time the market has a big up day the market has bottomed and the BULL market in force for the last 10 years has resumed.

Looking at the charts gives some perspective.

DOW daily
what can be seen?
1. Since the 8th November there is a downtrend
2.  in the down trend there are 2 counter trends up - 2 days and 1 day
3. yesterday's rally may be the 3rd.
4. The down trend has not been broken (Yet)
5. The rally needs to break 25400 before we get a higher high

So odds favour the move down

What can change this?
Well this morning there was, to quote DJT, fake news about a trade deal between China and the USA, which was lost in translation. (story here), and the futures leapt higher (DOW cash hot 24700 - just touched the down trend line).

So what dod that do?

Probably a lot of short sellers were stopped out of positions, and possible many entered long.
30 minutes later, all reversed and both bearish and bullish traders were "stuffed£

DON'T trade news


Wednesday, November 21, 2018

Crude thoughts

So crude oil has been relentlessly sold over the last month and a half..

remember things can go down in a straight line but not forever..

So is it time for a BOUNCE?

Look at the evidence, comparing price action and RSI.

On the daily chart there is positive divergence showing now (remember not an exact science), but this does show that the recent selling may be abating.

So where will the bounce go to?
Well using Fibonacci retracements (more on Fibonacci in the natural world also known as the Golden Ratio click here) .  Was God a mathematician ?  (video link) we can get an idea of where it may bounce to.

So if we look at the daily chart of crude, what is the positive divergence?
1. price has made a new low
2. RSI in the lower panel has not
indicated by the blue trend lines.

Will the move up be sustainable?
Well the down move was strong so any move up will be corrective, in Elliott Wave terms , the move up will be 3 waves (A-B-C) .

Then if OIL is in a bear move (evidence? - world is slowly changing to alternatives, electric cars, wind power, solar power, this will gather pace so oil may lose it's  standing as an indicator for the world economy over the medium term)
The next leg down will be even larger than this one if it is a wave 3 down (Elliot Waves - impulses are 5 waves)


Minimum target would be the 23.8 % retrace level ; Oil however tends ot overshoot both on the downside and upside so 38.2 % retrace is a very valid target.

Tuesday, November 20, 2018

The week begins with a BANG

At a crossroads now, looks like the bears have started the week in force..
BUT  ...it needs to follow through for the bear scenario to play out

Dow at a key level, above could be very bullish and below very bearish
weekly chart shows that now breaking below the trend line again - this tome could be decisive -despite it being a holiday week in the US (Thanksgiving).


in favour of the BULL

seasonality (Santa Claus rally)
still above trend line despite the brief break below


in favour of the BEARS

break below trend line - warning signal
negative divergence on longer term charts
all the talk on financial media is of "buy the dip" - especially CNBC and ironically the "Santa" rally
The reasons for the fall in October are still there:

1. rising rates
2. Future outlook for major companies uncertain
3. trade wear worries
4. European markets have been relatively weak


If follow through to the downside this week then the first test will be the October low;  At present it looks like the DOW could get to 23500-minimum - can change depending on the near term behaviour.

NASDAQ monthly
some perspective...
"What goes up must come down " - the question is "HOW far?"


Friday, November 16, 2018

Battle at the line - a look at the DJI

markets are still volatile with large intra-day moves
It seems that buyers are stepping in on the falls and sellers are selling the rallies..

At some point one side will dominate...

at the moment based on charts - the bears have the upper hand..

Look at the DOW first.
Monthly chart gives perspective...
It shows the extend of the rally.

At a minimum it should correct the rally from 2016, and looking at Fibonacci levels, 23.8 % would be around 24k.
38.2 % would be 22500, or thereabouts
61.8 % level is 19700  (BIG correction) - this level may tie in with a correction of the rally from 2008 i.e. a larger correction.

IF this is a correction of the rally from 2008 (about 7k to 27k) the corresponding fib levels would be:
23.8 % - c 22k
38.2 % 19k
61.8 % 14300  -

Notice that 61.8 % level of the smaller correction is similar to the  38.2 % level of the larger correction (KEEP 19k in mind)

ALSO notice the negative divergences between price and RSI which is a clue that a decline is on the cards


Zooming in to the weekly; shows key levels a bit clearer


Finally even shorter term , the DOW daily

This shows the battle between buyers and sellers at that trend line, with a break and then rally, and again another break.
The next post will be about the psychology of these breaks of trend, ANIMAL BEHAVIOUR - (or if you're precious about the human race , HUMAN behaviour)


Total Pageviews