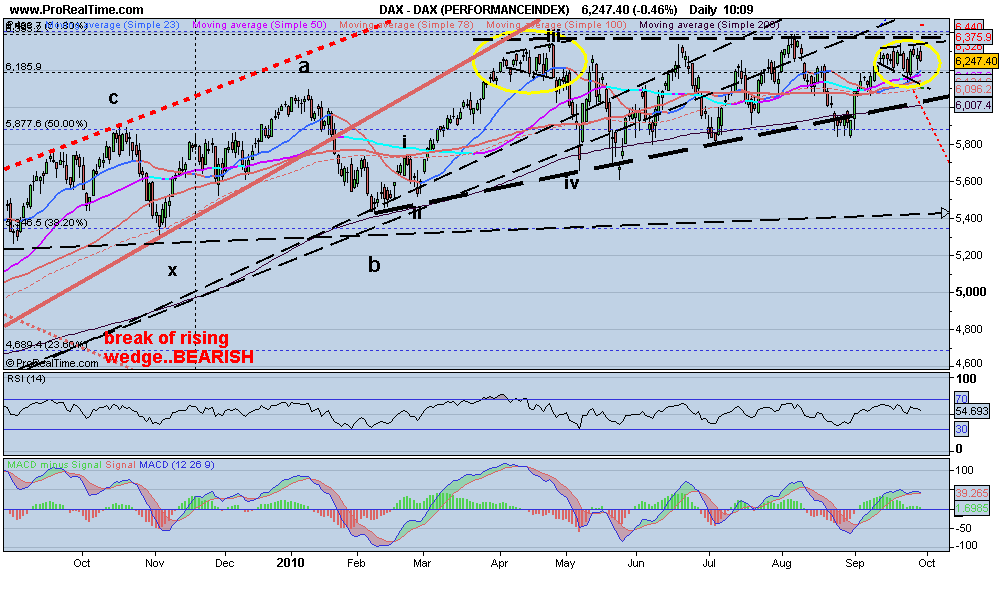
Dax has been in a range since Feb this year... UPPER BOUNDARY at 6360
Could be an ascending triangle (bullish scenario) with a break above 6360 signalling new highs..OR could be part of a rising wedge (which if it breaks t the downside would be BEARISH).
Since we are near the TOP of the range got to be short here, looking for at least a test of the lower boundary, or a decisive break lower (VERY BEARISH).
The weekly chart shows possible rising wedge, and the range bound formation, in relation to the all time highs
Technical analysis of Major Markets, F/X, and anything that can be traded This is my diary for trading Views expressed in this are only for educational purposes. They ARE NOT recommendations to BUY or SELL anything!! ALL comments and criticisms welcome.
Quotes
Look back over the past, with its changing empires that rose and fell, and you can foresee the future too.
— Marcus Aurelius
Followers
Search This Blog
Wednesday, September 29, 2010
Tuesday, September 21, 2010
BACK.....
Kids BACK to school...
Wife BACK to work
BACK to looking at the markets...
Starting off with some LONG TERM charts...
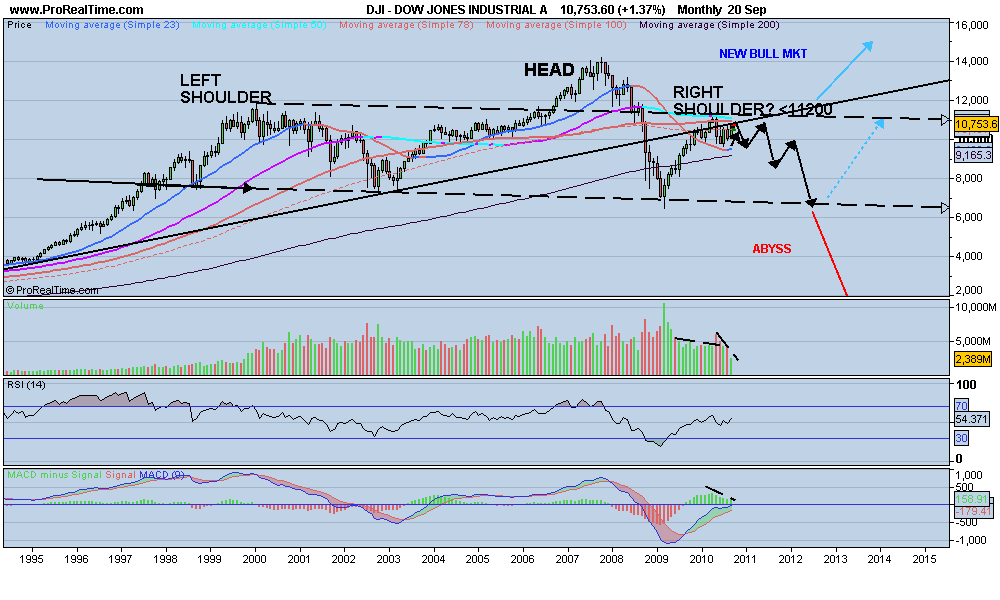
DOW JONES INDUSTRIAL ..The HEADLINE index (the one EVERY one watches, talks about etc)
The KEY level seems to be 11200 on the upside... 500 points away..
VOLUME doesn't SEEM to be confirming this move up.....
Many BEARS are DESPONDENT and some signs of CAPITULATION
Trading near the TOP of a channel..
DAILY CHART
Shows proximity to the monthly channel
Looking extended short term..pullback then a final move up to test that channel?
DAX MONTHLY
Also nearing RESISTANCE best seen on WEEKLY and DAILY charts..
DAX WEEKLY & DAILY CHARTS

Wife BACK to work
BACK to looking at the markets...
Starting off with some LONG TERM charts...
DOW JONES INDUSTRIAL ..The HEADLINE index (the one EVERY one watches, talks about etc)
The KEY level seems to be 11200 on the upside... 500 points away..
VOLUME doesn't SEEM to be confirming this move up.....
Many BEARS are DESPONDENT and some signs of CAPITULATION
Trading near the TOP of a channel..
DAILY CHART
Shows proximity to the monthly channel
Looking extended short term..pullback then a final move up to test that channel?
DAX MONTHLY
Also nearing RESISTANCE best seen on WEEKLY and DAILY charts..
DAX WEEKLY & DAILY CHARTS

Wednesday, August 11, 2010
NO CHANGE!!
Am on holiday, and there is no change for the markets in my view...
This previous post sums it up...click on it to see
A move above this years high delays the eventual process, but only delays.
DAX fractals still there...
Am in the UK and the noise on the ground is not good...companes looking to reduce staff further, house prices stalling again...
This previous post sums it up...click on it to see
A move above this years high delays the eventual process, but only delays.
DAX fractals still there...
Am in the UK and the noise on the ground is not good...companes looking to reduce staff further, house prices stalling again...
Saturday, July 17, 2010
AUDUSD weekly..
Bear case..I like the 23 week ma moving below the 50 week ma ..just...waiting to see if we get a more decisive move down..or if this is consolidation for a move higher...
We could be forming a bear flag for the next move down in which case I expect a break of the "flash crash" lows around 80..
if we are in a bull run a move above 89/90 means new highs or at least a test of the old highs
We could be forming a bear flag for the next move down in which case I expect a break of the "flash crash" lows around 80..
if we are in a bull run a move above 89/90 means new highs or at least a test of the old highs
Tuesday, July 13, 2010
FRACTALS
Looking at DAX weekly something caught my eye..maybe it's the heat!
The areas highlighted by rectangles look similar,,looks like one more thrust up to test resistance at 6340..then a pull back..one more test and ...F
A
L
L
A break above 6340 (clear) means new highs probably due..
The areas highlighted by rectangles look similar,,looks like one more thrust up to test resistance at 6340..then a pull back..one more test and ...F
A
L
L
A break above 6340 (clear) means new highs probably due..
Thursday, July 1, 2010
USDJPY
Seems like YEN strength vs dollar = weak equity markets, so here's the USDJPY weekly..
Looks like tracing out a triangle, and a break below the lower line could tie in with a BIG fall in equity markets. May be that we stay in the range for a while longer, as it is a weekly chart...but more warning signs??
DOW very LONG TERM
Just trawling through charts, here's DOW Industrial with lines drawn from a while ago, the arrows are recently added...
EURO GBP short term bottom or near?
Haven't looked at EURGBP for a while (due to personal circumstances been out for a while), but we broke down through 0.8455, but we have hit the lower descending trend line at around 0.8100 and bounced. This looks like could be key, though we are still in a DOWN TREND, may be a warning that EURO may have a period of strength vs Pound (which ties in with the previous post on cable).
Obviously a clear break below 0.81 and we could test as low as 0.78
CABLE
Recent rally "looks" like it could be ending, if so we could see 1.41 at a minimum over medium term.
Wednesday, June 30, 2010
DAX BIG head and shoulders still possible
Here's the chart from March 2010
and here is the one as of today...we are still in that large formation
A break through that red dashed line and all hell breaks loose , until then looks like we are still in that range 5600-6300 approx
and here is the one as of today...we are still in that large formation
A break through that red dashed line and all hell breaks loose , until then looks like we are still in that range 5600-6300 approx
BP
Will BP go bust?
Looking at the daily weekly and monthly charts..only the daily is showing some signs of a bottom (some positive divergence). Would be good to see it on the weekly and monthly as well..one to keep an eye on. Doubt it will go bust too many vested interests.. (40% of it's shareholders are based in the US, BP probably a large part of most pension funds, UK government will miss it's revenues...just a few)
Tuesday, May 25, 2010
DAX 3 hrs
Everybody starting to get bearish...am looking at 5500/5400 for support and possible LONG entry (if we get there)..alternatively selling 5750 may be the other trade to look for. Looks like we are in a wave 5 down..so once finished could get a decent upward correction, or if really bullish a push to new highs..
Wednesday, May 19, 2010
DAX head n shoulders?
Looks like a H&S playing out..we have broken the neckline, now need some follow through target 5700..the daily chart shows a possible bullish scenario...
Gold weakness
Gold weaker today...WHY? Simply overbought so some profit taking...looking to buy it on weakness..especially if it gets to 1160 ish..
Target is still 1348 min..
Tuesday, May 18, 2010
Friday, May 14, 2010
EURO L O N G T E R M
Monthly chart of EURO are we heading for 1.14? Which also coincides roughly with 61.8 % retracement of the rally from November 2000...
Then it may be the turn of the US dollar to collapse....
Monday, May 10, 2010
DAX 30 mins
Tuesday, March 30, 2010
reflective time...
An aside from the markets..
Now we are coming up to summer ..(at least in S Spain) and the clouds are clearing ..thank God !!...we are finally getting to the task of clearing the land..and need to get the vegetables in the ground..
With the weird weather across Europe and especially down here..it seems that we are in store for higher food prices..some early vegetables have been wiped out by waterlogged conditions and only now is it possible to plant. the problem being that the plantlets will not have the "good" i.e. not too hot temperatures for very long so roots will be less developed. The "heat" will arrive soon, which means a lot of plants will not have developed bug enough root systems to carry them through the summer, and once it heats up here the top 3 inches or so turn to rock!!
If you are interested in a Southern Spanish holiday home click here .
Now we are coming up to summer ..(at least in S Spain) and the clouds are clearing ..thank God !!...we are finally getting to the task of clearing the land..and need to get the vegetables in the ground..
With the weird weather across Europe and especially down here..it seems that we are in store for higher food prices..some early vegetables have been wiped out by waterlogged conditions and only now is it possible to plant. the problem being that the plantlets will not have the "good" i.e. not too hot temperatures for very long so roots will be less developed. The "heat" will arrive soon, which means a lot of plants will not have developed bug enough root systems to carry them through the summer, and once it heats up here the top 3 inches or so turn to rock!!
If you are interested in a Southern Spanish holiday home click here .
Thursday, March 11, 2010
Euro daily basing or consolidating?
Couple of possible scenarios. For now looks like we will get a choppy rally up in wave iv before a wave v down..
IF the move down has finished we should see some good mini rallies to signal a change in trend
Subscribe to:
Posts (Atom)