Quotes

Look back over the past, with its changing empires that rose and fell, and you can foresee the future too.

— Marcus Aurelius

Followers

Search This Blog

Tuesday, December 3, 2013

DAX correction imminent?

Daily chart may be turning..if so what does WEEKLY look like...................


When turn comes can correct quite a bit and not even dent weekly up trend..


Monday, November 25, 2013

No change in UPTREND ..YET.but some warning signs?

DAX

#New all time high !
BUT ..

FTSE seems to be lagging or is it LEADING??  could be froming a bull falg..but surprising with DAX at ATH it hasn't accelerated UP..as yet...

INSIDER selling seems to be picking up over last few weeks..sells about 2 to 3 times more than buys
Data from here  http://j3sg.com/

Gap up open today..maybe  some PANIC buying finally coming in ? Sign of retail feeling left out?

Charts

DAX


FTSE

Bull flag or topping? Weekly chart may give some clues?


FTSE WEEKLY

Not much clue here still looks like 2 possibles bull flag or double top.. a decisive break above would mor elikely mean NEW ATH as well..

How about monthly?


 FTSE MONTHLY

Monthly LOOKS like a top and possibly important one forming, HOWEVER a MONTHLY chart is LONG term.. best to keep it in back of mind...
RSI starting to show some neg divergence..
Previous tops took over 8 months to form..whipsaw and false breaks up and down.


DAX MONTHLY

Thrown in for good measure..
Broken out..
accelerating up..
Only caution is RSI starting to enter overbought, but would suggest at moment no change in trend.


Thursday, October 10, 2013

Update DAX, FTSE

Still twitchy markets, hanging on political situation in USA

DAX daily

Despite all the political turmoil in the USA, the DAX has been very resilient and the down move least pronounced of the European markets.
It seems to suggest that actually the recent down trend is just a correction, and once the political scene in the USA is resolved (which it more likely will be), markets will attempt new highs.  QE likely to continue.


FTSE daily

The FTSE has corrected more sharply than the DAX and has nit made all time highs yet, possibly due to strength of the pound in recent weeks, plus a hit on retail sector, and mining.  QExpecting that more liquidity around the world will eventually raise inflation expectations and tangible assets will rally.


Thursday, September 26, 2013

DAX month of gaps and range

Since Sept the DAX has basically traded in a narrow range, with the big moves coming on overnight GAPs to the upside, coming at all time highs.

After the last gap to all time highs (high 8771) the market has traded back to gap support around 8600 and for 4 days traded in a very narrow range 8700 to 8600.  What next?

Waiting for a break of 8600 for a bigger move down

or a break above 8700 to see if the bull move is renewed and new ATH on the horizon.

proceed with caution if a BULL tighten stops
if a BEAR beware breaking to new highs, may go further and faster than one may think

Daily chart


DAX weekly


Wednesday, September 4, 2013

DAX bull move intact

DAX 

The BULL move since Sept 2011 is STILL intact and EVEN a fall to 7950 wouldn't change this much.
If it finds support at or above this level, a good chance of new ATH or at least a retest of the highs.

ALTernative : The market is in the process of correcting the advance from JUNE 2011 a 62% retrace would be around 7050

OR the market is correcting the advance from SEPTEMBER 2011 , a 62 % retrace would be 6400

Obviously the latter scenarios (IE bigger corrections) will not be straight line affairs, but would change market from BULL to med term bearish (or short term bearish to med term bearish)


Wednesday, August 28, 2013

Monthly perspectives FTSE, DAX, S&P, DOW

A look at the monthly charts for major indices, LONG TERM.  Looking toppy ..but as they are longer term, may take a month or so to play out.  UNLESS they break significantly higher then odds are that the next BIG move is down, whether it be correction or END of this BULL MARKET from 2009.
A look at the charts shows some bearish divergences starting to show which in the past have all signalled start to significant down moves.

FTSE


DAX


S&P 500


DOW


Tuesday, April 16, 2013

Correction finally here? Fibonacci retraces

Have the equity markets finally reached a short term peak?

Look at weekly charts

FTSE

showing previous corrections related to Fibonacci retracements
So if a correction has started for worldwide indices can probably expect FTSE to find a low either at 38.2 % retrace 6125 or 61.8 %  5955 (approx)


now adding on some trend lines


DOW weekly


Monday, March 18, 2013

Perspective

The TREND is UP for most things, despite today's drop. Is today's drop the start of more significant correction? Or a bear trap?

FTSE

Sell support?or BUY support?


Tuesday, March 12, 2013

Commodities ready to make their move?

Commodities may be bottoming

Gold daily

near support
in down trend still but at bottom of channel and horizontal support close by 1550


Gold weekly


Copper daily

testing lower boundary of triangle (see weekly chart)
rebound to 377? 7%


Copper weekly


Silver daily

closer to support
at bottom of down channel
positive divergence RSI price


Tuesday, March 5, 2013

Finally a break out to the upside imminent

Are the markets poised to break higher..finally?
The consolidation has been longer than expected BUT
the downside has been limited
the weak longs are probably shaken out
the bears have been given some hope

so NOW the market may be ready for new highs

FTSE  4 hr chart
A break above 6426 and holding should mean a new high for the FTSE.
and eventually possible all time high


DAX

Similar to FTSE long consolidation after rally from November.  Again, despite only giving back max 4% the sentiment has been increasingly bearish.
Next hurdle for DAX is 7865


Euro vs USD

All currencies have been weak vs the USD recently. On the Euro daily chart it looks like some positive divergence creeping in.  Euro may be due for a rally, and conversely the dollar due a fall?


AAPL

still not getting any love and hatred increasing. 406 next support after that 380
Yesterday finally filled a gap
Despite AAPL falling NDX has been holding well, if/when AAPL rallies NDX has a bull flag target of 2900


Quick look at NDX


Tuesday, February 26, 2013

Rally not finished ..YET

Even though it feels like it yesterday's falls in equity markets (blamed on various things..Italian elections, US FISCAL CLIFF part II! etc etc) probably is NOT the beginning of a sustained bear market move.
Sentiment has reversed quickly , with the FEAR factor rising  rapidly..NOT normally the way BEAR mkts start

Looking at the weekly charts

DAX

Weekly chart
Hovering at support 7570/7580
would need to break that significantly for more sustained correction

trend line support and horizontal support  seen better on DAILY chart


FTSE weekly


Daily chart


Friday, February 22, 2013

Bells are NOT rung at market tops

The press is turning bearish.
Is it a TOP?
Very unlikely..
Correction likely, but with all the press calling for a SLIDE the risk is more to the upside the the downside


Wednesday, February 20, 2013

DAX

The DAX has been off everyone's radar on last few weeks..
Under performing, why? Well it had a big run up from NOV lows 13%, and despite FEELING bearish in last few weeks, has only retraced 4%.

Support  found around 7570
Has rallied 200 points in 2 days so short term may pull back.

Longer term consolidation looks to be over and ready for challenge on new highs


FTSE Next stage of rally

Looks like the consolidation has finished..now where

FTSE daily

found support at mid line of the up channel
Looks like should test upper boundary @ 6456 (approx)
TREND still UP


FTSE weekly

At resistance 6380. next target 6550
ALL time high looks like it will be tested, not necessarily bested.


Wednesday, February 13, 2013

Consolidation over?

DAX and FTSE have been consolidating after rally from November lows.  Is the consolidation finished?

It's looking increasingly like it.  Markets have given very little back; bears will be getting nervous, and buyers seem to be pressing.  The next rally could be the end of this run, but with quite a lot of bears around it may run further than expected.
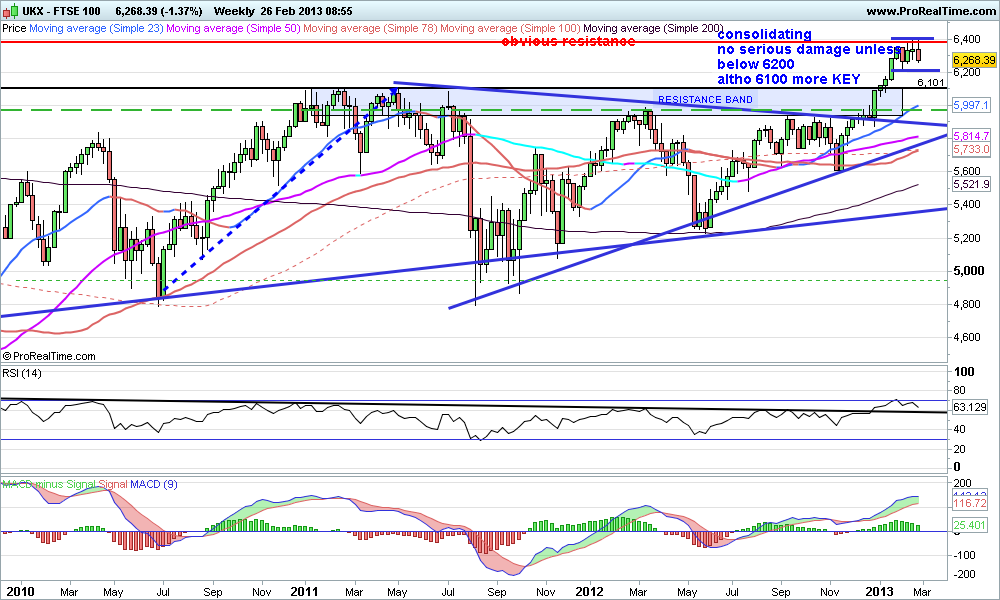
FTSE
Looks like it has respected the channel it is in and bounced off the mid point
rally should head towards upper boundary 6426


DAX

seems to have found support at 7570
above 7726 should accelerate as bears give up
target minimum the highs..7860 though probably higher


NDX Nasdaq 100

After the big gap up traded in range 2700 /2760
very dependent on AAPL 
BUT has broken above that range
expect support 2750.2760
rally should carry eventually to 2890 or higher
Use AAPL weakness to buy dips!!


AAPL

Stiff resistance at 500
probably range bound 440 to 500


DJIA

 high level consolidation
everyone "expecting " correction
so probability is it heads higher..
a break above 14200 may accelerate


Wednesday, February 6, 2013

Can't see the wood for the trees!

Imagine looking at an oil painting from a distance of a couple of inches? You would not see much of the whole picture, a few splodges of paint.

Sometime charts can be like that especially if one is looking at them day in day out.  So at times it is best to STAND back so one can see the whole picture. That is look at the LONGER time frames, like the Monthly and Weekly charts.  Then it may become clearer what that picture is telling one!

Monthly Charts below
Pretty self explanatory

AUDUSD


CABLE


EURUSD


FTSE


DAX


DJIA


Total Pageviews