Quotes

Look back over the past, with its changing empires that rose and fell, and you can foresee the future too.

— Marcus Aurelius

Followers

Search This Blog

Friday, November 30, 2018

"To subdue the enemy without fighting`is the supreme art of war." - Chinese philosopher Sun Tzu

G20 - weekend it's a CRAPSHOOT -a risky or uncertain matter.

full of news - will Trump and Xi agree to be friends?
(I put it in the vernacular form, as Trump speaks like this - and quite often in a very child-like form, which is probably why he appeals to half of the American people)


So  looking at the charts :
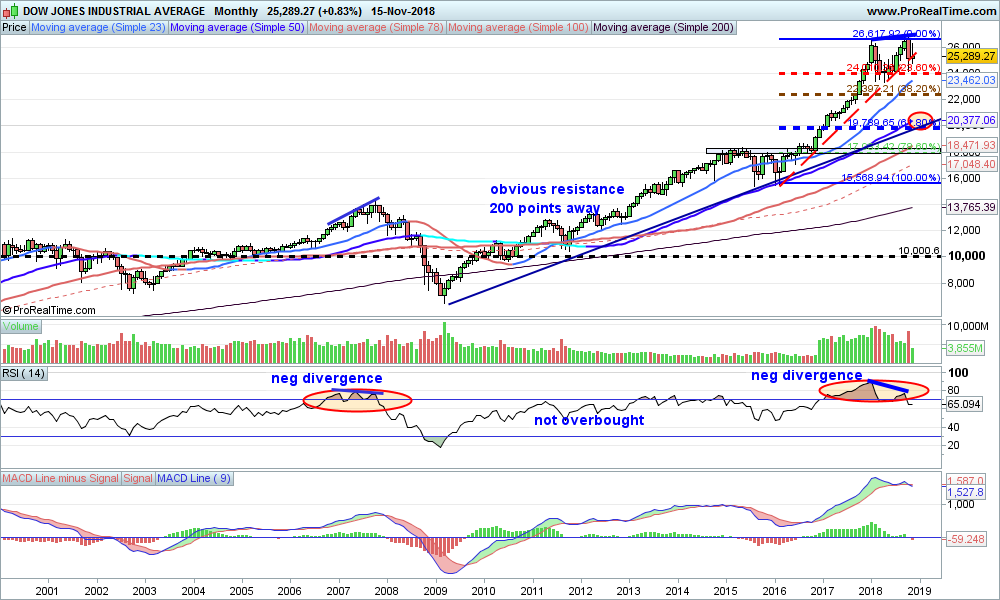
Dow Industrial  - (I'm not an expert in candlestick formations but do refer to a book I have dealing with Japanese Candlestick charting)
What can we see?

1.  In candlestick terms each of the highlighted moves has a long bullish candle, followed by a "spinning top" - a sign that buyers and sellers are evenly matched or indecisive.
2. Looking at the firs 2 highlighted patterns : these are called " Evening star" they usually occur at the top of a trend.
3.  This implies that the next big move will be down..HOWEVER as this weekend is a CRAPSHOOT - several scenarios can happen.

a.  A large gap and crap
b.  large gap up and continue
c.   large gap down and recover
d. large gap down and continue
e small range trade

"Do I feel lucky?' Well, do you, punk?" 


So...if you're feeling brave - take a position
If not flat is also a position - and there will be trades to do after the event.


Tuesday, November 27, 2018

Have the markets bottomed?

If you listen to CNBC then you would probably think that every time the market has a big up day the market has bottomed and the BULL market in force for the last 10 years has resumed.

Looking at the charts gives some perspective.

DOW daily
what can be seen?
1. Since the 8th November there is a downtrend
2.  in the down trend there are 2 counter trends up - 2 days and 1 day
3. yesterday's rally may be the 3rd.
4. The down trend has not been broken (Yet)
5. The rally needs to break 25400 before we get a higher high

So odds favour the move down

What can change this?
Well this morning there was, to quote DJT, fake news about a trade deal between China and the USA, which was lost in translation. (story here), and the futures leapt higher (DOW cash hot 24700 - just touched the down trend line).

So what dod that do?

Probably a lot of short sellers were stopped out of positions, and possible many entered long.
30 minutes later, all reversed and both bearish and bullish traders were "stuffed£

DON'T trade news


Wednesday, November 21, 2018

Crude thoughts

So crude oil has been relentlessly sold over the last month and a half..

remember things can go down in a straight line but not forever..

So is it time for a BOUNCE?

Look at the evidence, comparing price action and RSI.

On the daily chart there is positive divergence showing now (remember not an exact science), but this does show that the recent selling may be abating.

So where will the bounce go to?
Well using Fibonacci retracements (more on Fibonacci in the natural world also known as the Golden Ratio click here) .  Was God a mathematician ?  (video link) we can get an idea of where it may bounce to.

So if we look at the daily chart of crude, what is the positive divergence?
1. price has made a new low
2. RSI in the lower panel has not
indicated by the blue trend lines.

Will the move up be sustainable?
Well the down move was strong so any move up will be corrective, in Elliott Wave terms , the move up will be 3 waves (A-B-C) .

Then if OIL is in a bear move (evidence? - world is slowly changing to alternatives, electric cars, wind power, solar power, this will gather pace so oil may lose it's  standing as an indicator for the world economy over the medium term)
The next leg down will be even larger than this one if it is a wave 3 down (Elliot Waves - impulses are 5 waves)


Minimum target would be the 23.8 % retrace level ; Oil however tends ot overshoot both on the downside and upside so 38.2 % retrace is a very valid target.

Tuesday, November 20, 2018

The week begins with a BANG

At a crossroads now, looks like the bears have started the week in force..
BUT  ...it needs to follow through for the bear scenario to play out

Dow at a key level, above could be very bullish and below very bearish
weekly chart shows that now breaking below the trend line again - this tome could be decisive -despite it being a holiday week in the US (Thanksgiving).


in favour of the BULL

seasonality (Santa Claus rally)
still above trend line despite the brief break below


in favour of the BEARS

break below trend line - warning signal
negative divergence on longer term charts
all the talk on financial media is of "buy the dip" - especially CNBC and ironically the "Santa" rally
The reasons for the fall in October are still there:

1. rising rates
2. Future outlook for major companies uncertain
3. trade wear worries
4. European markets have been relatively weak


If follow through to the downside this week then the first test will be the October low;  At present it looks like the DOW could get to 23500-minimum - can change depending on the near term behaviour.

NASDAQ monthly
some perspective...
"What goes up must come down " - the question is "HOW far?"


Friday, November 16, 2018

Battle at the line - a look at the DJI

markets are still volatile with large intra-day moves
It seems that buyers are stepping in on the falls and sellers are selling the rallies..

At some point one side will dominate...

at the moment based on charts - the bears have the upper hand..

Look at the DOW first.
Monthly chart gives perspective...
It shows the extend of the rally.

At a minimum it should correct the rally from 2016, and looking at Fibonacci levels, 23.8 % would be around 24k.
38.2 % would be 22500, or thereabouts
61.8 % level is 19700  (BIG correction) - this level may tie in with a correction of the rally from 2008 i.e. a larger correction.

IF this is a correction of the rally from 2008 (about 7k to 27k) the corresponding fib levels would be:
23.8 % - c 22k
38.2 % 19k
61.8 % 14300  -

Notice that 61.8 % level of the smaller correction is similar to the  38.2 % level of the larger correction (KEEP 19k in mind)

ALSO notice the negative divergences between price and RSI which is a clue that a decline is on the cards


Zooming in to the weekly; shows key levels a bit clearer


Finally even shorter term , the DOW daily

This shows the battle between buyers and sellers at that trend line, with a break and then rally, and again another break.
The next post will be about the psychology of these breaks of trend, ANIMAL BEHAVIOUR - (or if you're precious about the human race , HUMAN behaviour)


Thursday, November 15, 2018

Apple succumbs to gravity

Quick look at Apple Inc.

Huge stock for the market due to it's weighting in indices and as a company; a bell-weather for tech stocks.

What does the recent fall do to prospects for the future?
The monthly chart puts it into perspective - a HUGE rally, which is now correcting BIG question is where to?


Looking at the weekly for a closer look
Highlighted areas are horizontal price supports
Close to the first one and the up trend line, (the steeper one).  This is probably good for a short term bounce.


Now zoom in to the daily
A little more to the downside to really test the horizontal support at 180 approximately


Wednesday, November 14, 2018

13 - unlucky for some -

Crude oil.

13 days down

"What goes up must go down" and vice-versa.

When will it bounce?


The chart shows the steep down trend which is still in force...
BUT conditions look oversold.

Trading is all about probability..

Chances are increasing that there will be a snap back...at least to test the down tend.

I would expect then another test of the lows and possibly a lower low, but watch the RSI - if it fails to make a new low probability then increases for a more sustained rally.

Until then nimble trading ..


Tuesday, November 13, 2018

That didn't last long..

The post mid term election rally - just fizzled out.  Where to now? Looks like we consolidated the initial move down with a 6-8 day rally (depending on the market you look at), and now markets are in the next leg down...

1. will this be a 3rd wave down?(longest and strongest)
2 is this still correcting the trend up since  2008


As seen from the chart above - monthly DOW - the rally from 2008 to 2018 was huge roughly 20,000 points.  It is not inconceivable to correct to FIB levels...we are close to 23.8  and on the chart the blue shaded area is the 38.2 % level...19200 (approx).

I like looking at the long term as it cuts out the daily "noise".

Talking heads (CNBC) still talking about how it's right to buy the market here..gut feeling is that they will be proved wrong... in the short to medium term..

Obviously it all depends on the time frame one is looking at.

DOW weekly shows the 2 week bear flag - measurement suggests minimum 23200 as a target as indicated on the chart.


Thursday, November 8, 2018

Crude oil 3 charts


Monthly chart (top) shows a LONG term view.  Longer term oil is still in a down trend from it's peak at around 200 USD per barrel.

Weekly chart (middle) shows that price is approaching a support zone, previous support and resistance area around the 58 USD mark.
Not oversold yet on weekly.

Daily chart:  shows the support zone more clearly.  Looking oversold but no divergence between RSI and price.
See below for an example of positive divergence between price and RSI


Post mid-terms

Wow - so the result was more or less what was predicted in the polls, and the markets had a HUGE rally.

Since the low of 2 weeks ago the DJI is up 2000 points.

Are we on our way to new highs?

Looking at the charts.

DJI - Daily chart with possible Elliott Wave count (BULLISH MEDIUM TERM)


Notes : Elliott Waves (click here for more information https://bullwaves.org/elliott-wave-course-define-dominant-trend-using-elliott-wave)
Elliott noticed that markets move in impulses (5 waves) followed by corrective waves (3 waves)

There can always be different wave counts (alternatives) - but it CAN give a clue as to market direction

so if we are in a final V wave up for this bull market to NEW all time highs, and we have had wave i and ii, then we are in wave iii.  The recent 2000 point rally COULD be the start of wave i of iii of 5, may not be finished

when it does finish then we should get a wave ii down before the wave iii of V.

Wave 2's can be deep which may suck in bears thinking that this is the next leg down.
(THAT COULD BE AN ALTERNATE COUNT)

Looking at the DAX in Germany (and FTSE similar);  despite the HUGE rally in the US the market remains subdued.  This could change with a break above 11800 which would invalidate the Head and Shoulders formation (previous post)

This may tie in with a fall in US markets- whatever there is a disconnect at the moment..but a fall in US could continue the correction ...
Alt: US continues to rally and DAX breaks upwards

Monday, November 5, 2018

Big week ahead -

This week will be full of the mid term elections in the USA voting on Tuesday.

News can move markets short term - but generally speaking unless it's a bolt from the blue (KCTM, Lehman  etc) the charts can help to navigate the turbulent waters, keep an eye on resistance and support.

The chart below shows the DOW daily and a BULLISH set up from an Elliott Wave perspective.

I'm no expert but I know that an impulse is 6 waves which is then followed by a 3 wave corrective. This is the simple explanation as waves can sub-divide.


Bullish:  we have finished wave 3 and the recent fall has been a correction i.e. wave 4 and now we are in the final wave 5 up.  The rally from the lows may be a wave 1 and we are now in wave 2 down..wave 2 down can be quite deep - it will suck in the bears thinking this is the start fo a new bear market (if it break the recent low - it MAY BE).

If we hold then we should have a good rally which will eventually make a new all time high.

Be nimble this week, don't get married to a view or position.  It will be volatile - and could offer some good opportunities if we get large moves up or down

Thursday, November 1, 2018

A look at the DAX

So yesterday was a strong rally day - have markets turned the corner.

All the talking heads were very bullish and still talking about bottoms (market ones!)

- that to me is a warning that it ain't over yet.

After 11 or 12 days down - it is NORMAL to get a counter trend  - 2-3 days or sometimes an extended correction 7 days..

Bear market rallies are VICIOUS - as real buyers step in and short sellers also cover positions


Remember VOLATILITY will continue, there will be wild moves, you have to be NIMBLE.  
Most traders lose money in bear markets - due to the volatility

DAX rising wedge - tends to be a bearish formation


at the moment midday London time, it looks like a failed break out or throw-over..but that could change during the next 3-4 hours.  

Key level - if break to downside 11400 , probability of down trend continuing increases.
Conversely follow through above 11575  favours 11700-11780 (test of neckline of heand and shoulders**)

**  Remember if patterns fail the move can be dramatic in the opposite direction, i.e. if a head and shoulders top fails a sizeable rally would probably occur

Probably/probability/  looking at charts is not predicting moves but working out probabilities of certain events happening - sometimes more than 2 options may be seen


Total Pageviews