Quotes

Look back over the past, with its changing empires that rose and fell, and you can foresee the future too.

— Marcus Aurelius

Followers

Search This Blog

Tuesday, December 31, 2019

AAPL parabolic

Apple - bellwether stock - widely owned by individuals and funds, huge index weighting - so all index-linked funds have to be heavily invested - everyone knows it's a "great" company ;)..so what next?
Below is the quarterly chart, with a parabolic rise laid over the top.  "Parabolic up moves are exciting to ride, but there is the almost certain danger that the rocket will run out of fuel, resulting in a rapid collapse of prices. Trying to pick the final top for this kind of move could be hazardous to one's health, but being aware of the potential danger can be useful in managing positions."


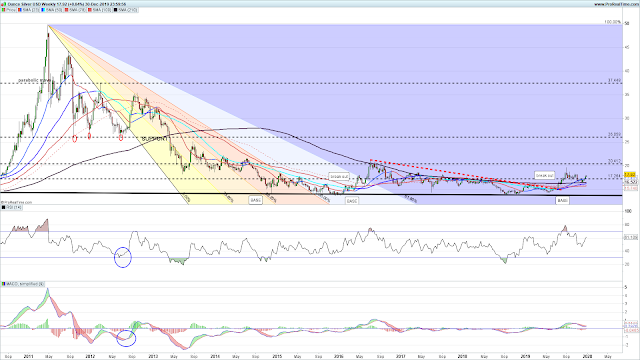
Below the AAPL chart is the weekly silver chart which shows a parabolic move in 2011 and the subsequent collapse.  I'm not saying that the top is in AAPL - but care is needed. 


Friday, December 27, 2019

2019 draws to an end - what's the state of play?

OK, 2019 draws to an end - and markets are still in bull mode - now the bull has been running for over 10 years - is it about to run out of energy?

The usual suspects are still pushing -
Low rates - forces investors to seek returns in riskier assets - (equities etc)
Election year in the USA (2020)
China trade - (a deal! - BIG deal?)
Brexit on way to completion? (positive? )
Here's a video of our current PM - showing how "eloquent" he is


Looking at the charts
Starting with a look at the Fear and Greed index overlaid on the Dow Jones Industrial average. (can be found HERE)

At the moment it looks like we are in Extreme greed mode - probably some caution warranted into the New Year -
Below is NDX 100 with same overlay but on the weekly chart


Saturday, November 2, 2019

Ho hum - bull or bear - take your pick!

Nasdaq 100 -

2 scenarios - 1 Bullish - 2 Bearish
Which is more probable?  
probably scenario 1 - low rates here to stay, Fed, ECB and other central banks pumping liquidity into markets - which forces savers to look for returns in riskier assets (stocks, bonds etc)
BUT  there is always a probability for scenario 2 - maybe a, "wake up and smell the coffee moment" i.e.  the "people" finally realise that the Emperor really is wearing nothing!


1 Ascending triangle with a break out at week ending 01119


2 Rising wedge


Friday, October 18, 2019

Chop, Chop

The markets are playing with US!

Breakouts to the upside - no follow-through

Breakouts to the downside - no follow-through

WEARING market participants out

Basically, the bus is slowly being emptied -
BOTH buses!

BEAR BUS
if you can trade a bear move and get it RIGHT - it can be exhilarating  - Think rollercoaster ride

 BULL BUS
Bull moves - slow and steady (generally) not as much adrenalin rush


What does this look like on a chart?

Nasdaq weekly
clear rising wedge (usually a bearish formation, although to really clear the bus, typically it will rally above the line  (shorts will run for cover and bulls will load up), before a sharp reversal.

Conversely - if it breaks down, similarly it will fall sharply and then rally to re-test the break - catching many market participants out

With ALGO trading dominating the current market,  the moves will be exaggerated
Step back to see the TREES!


Saturday, October 12, 2019

Still playing the markets

TRUMP changes mind

"Trump had said previously he would not be satisfied with a partial deal to resolve his effort to change China’s trade, intellectual property and industrial policy practices, which he argues cost millions of U.S. jobs. On Friday he said he had decided that a phased approach was appropriate."

So it looks like the back and forth of "deal or no deal" will be an ongoing theme for months and possibly years to come.


The markets were euphoric about the "latest deal" though the details were not released until after the market close on Friday - 

So some scepticism to come for next week?

Charts :
easy money and trade optimism are pushing indices to new highs, bell-weather stock  AAPL, also reached a new high on Friday.

DOW daily
Friday left what could be a shooting star (www.investopedia.com)
Warning that uptrend may fail..

The key to this will be the price action on Monday.


Thursday, October 10, 2019

China v USA v Europe

Which one is which?


The world order is changing - and we are witnessing a LONG TERM shift in power from West to East which could last decades !


Wednesday, October 9, 2019

Dow Industrials

still in the throes of a trade war dominated environment - but longer-term NEWS doesn't matter?


Still looks like an ED; In August, it broke the lower uptrend line; and then consolidated for the month, then breaking higher - HOWEVER the rally failed at 27500 (possible DOUBLE TOP?)

Now threatening to test the lower trend line of the ED (wedge).

If the ED has completed - expect a breakdown of the lower trend line - followed by a more prolonged bear move - (correction of 2016 brally  or even the 2008 rally) 

If it HASN'T completed; expect a bounce and a rally to new highs (throw-over), and THEN a rapid retrace of the ED and breakdown as above.

If this is just a consolidation, a sustained break above the top of the wedge (ED) and then more prolonged bull move (pushed by lower rates, China trade deal)


Total Pageviews