I've been bullish since Oct last year but now am leaning bearish at least short term expecting a decent pull back in markets soon , after which it will be a buy opportunity again
Prob a 10 % decline
Everybody on mainstream financial news turning bullish so going to do opposite!!
Wednesday, February 29, 2012
DAX nearing resistance band
DAX WEEKLY
Dangerous using Elliott waves , but looks good!
So IMO nearing some hefty resistance, question is "is there one more push up left?" before the correction?
DAX is up 30 % from the November 2011 lows..with barely a pause..
Maybe a push up to above 7000 to suck in late longs and stop out shorts before markets turn.
5-10 % correction would be healthy..
Ideally a small drop and new highs first before larger correction, but larger correction could start here.
Looking at AUDUSD (risk on risk off leading indicator) it has broken out of bull flag, so new highs SEEM likely..
BUT BE NIMBLE!!

DAILY CHART
On the daily the major resistance is the shaded light blue area (6990-7100). Feeling is market will try and pierce this, before deeper correction.

Cable consolidation over? or topping?
Cable (GBPUSD) seems to have consolidated it's move up from the lows at 1.53


Now at resistance near the 200 day ma, and horizontal resistance. A significant break above clears way to 1.6140 and beyond as per previous post here
Looking at the daily chart
This shows the horizontal resistance levels clearly
Also the recent corrective action could be an Elliott wave ABC correction.
Move from Jan low (1.5256) to Feb high (1.5898) = 642 pips
if next move is equal to this 1.5936 + 642 = 1.6578 (ie close to 1.66)

4 hour chart
Pull back possible before heading higher..
Can be short at 1.5930 with a tight stop
Or wait for pullback and stop below 1.58
If break out higher 1.62 target off the 4 hour chart ( close to 1.6140 target off daily chart above)

Tuesday, February 28, 2012
APPLE falling out of the tree?
APPLE still in the process of forming negative divergences, new highs in PRICE but RSI is struggling. Not a short yet, but could be time for taking some profits to re-enter long after the correction
Correction should be dramatic when it comes..

Correction should be dramatic when it comes..

Aussie dollar vs USD
Looking at the AUDUSD which has been the RISK ON RISK OFF indicator for a good while now..
It looks like it is in the process of forming a BULL FLAG and very near resistance between 1.07 and 1.08. If it breaks out expect a test of the highs at 1.11, which should also coincide with an upside break out for equity indices especially US ones, which could be the EXHAUSTION RALLY before a sizeable correction (or dare I say it the TOP?)

As I speak S&P 500 looks to have broken the high at 1370 (cash 1373) and may encourage short covering and momentum players in the market (GOOD TIMING ..NOT!)
Crude oil and petrol prices
Well after filling up the car a week and a half ago at 1.41€ per litre, and yesterday noticed that it has now gone up to 1.44€ a litre a 2.12 % increase in under 2 weeks!
So the increase is all blamed on rising crude oil prices ..HOWEVER in July 2007 crude oil was at a record 180 $ per barrel, and prices at the pump reached the low 130's (centimos) per litre...
Look at the graph below you can see that prices at the pump dropped when crude oil dropped , BUT since then have raced ahead of crude oil prices
The blue line = prices at pump
Since Jan 09 crude oil has been rangebound roughly 80-110 USD per barrel, yet the prices at the pump have continued to rise....
As usual Europeans continue to pay through the nose for petrol and governments continue to rake in tax revenues the higher it goes...

Thursday, February 23, 2012
Commodities Gold, silver, Crude oil, Copper
GOLD
broke out now looking to challenge 1800 resistance level.

SILVER
Approaching down trend line, and 200 day MA at 35.03.
a break above could see sharp rally

CRUDE OIL
Above resistance at 104, after large consolidation. Oil short term overbought, but with tensions rising with Iran, should not give much back and may well be on to much higher targets 129 (measured move). Initial target 111/115 before significant correction

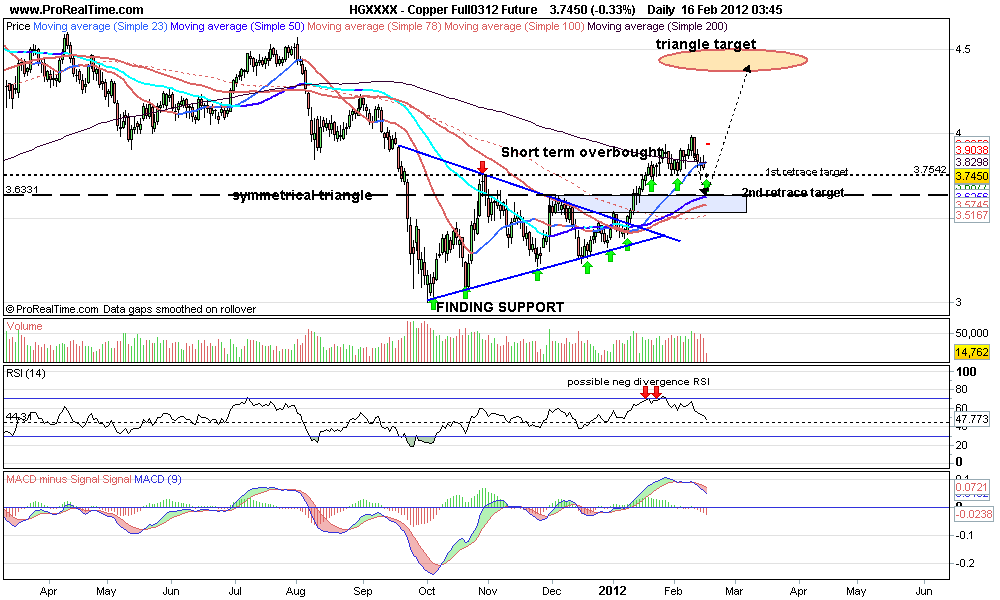
COPPER
Copper may also have competed a correction from overbought levels. Key level downside 365. If correction over should now be heading to 400, and beyond that the triangle target is still at 450 ish.

broke out now looking to challenge 1800 resistance level.

Approaching down trend line, and 200 day MA at 35.03.
a break above could see sharp rally

CRUDE OIL
Above resistance at 104, after large consolidation. Oil short term overbought, but with tensions rising with Iran, should not give much back and may well be on to much higher targets 129 (measured move). Initial target 111/115 before significant correction

COPPER
Copper may also have competed a correction from overbought levels. Key level downside 365. If correction over should now be heading to 400, and beyond that the triangle target is still at 450 ish.

Waiting for the exhaustion rally..
Equity markets have been doing relatively little this week..Likely scenario seems to be an upside break out for most markets which will be received with euphoria on mainstream TV (think CNBC!), and will probably signal the start of the correction (markets do not go up in straight line forever). The charts below show the case for upside break outs, also some warning signs in the tech sector (NDX, AAPL). I give it 70 % probability?
OR we fail to break out and then correct from here. 30 % probability?
FTSE
Finding support at high levels around 5910 after poking above resistance at 5920. If move gains traction then expect move to 6000/6100.

DAX
struggling near resistance at 6930. Possible negative divergence setting up on daily chart. 6930/6950 was support level various times during 2011.

Nasdaq 100
Overbought under-performing this week. Negative divergence forming. Also main component AAPL, possible negative divergence.


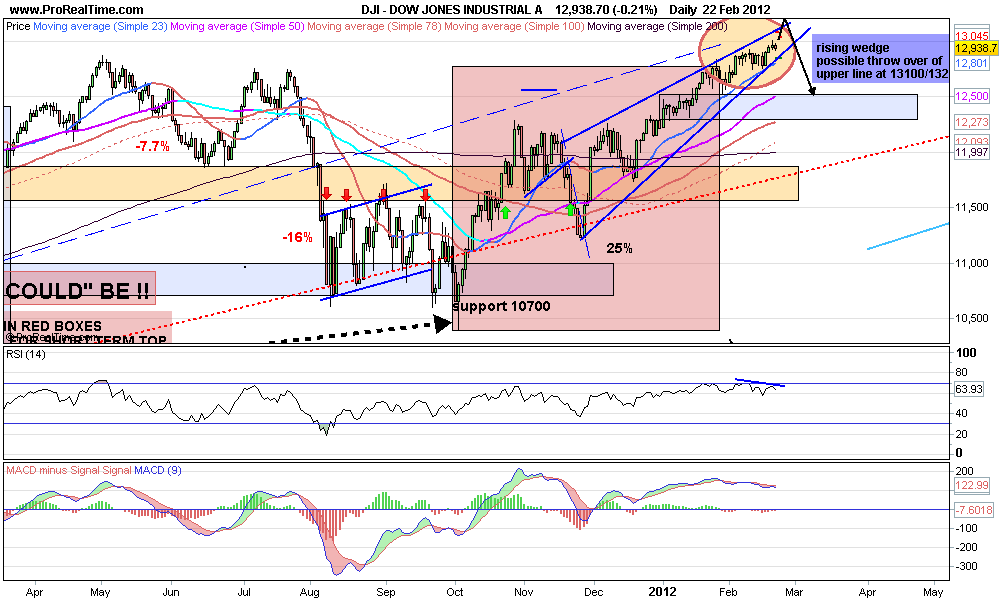
DOW INDUSTRIAL
struggling near 13,000 level. Rising wedge formation (bearish), 13,00o psychological round number, and break out there could see 13100/13200 quickly, before a significant reversal probably targeting 12500

OR we fail to break out and then correct from here. 30 % probability?
FTSE
Finding support at high levels around 5910 after poking above resistance at 5920. If move gains traction then expect move to 6000/6100.

DAX
struggling near resistance at 6930. Possible negative divergence setting up on daily chart. 6930/6950 was support level various times during 2011.

Nasdaq 100
Overbought under-performing this week. Negative divergence forming. Also main component AAPL, possible negative divergence.

APPLE
Negative divergence forming price/RSI. Warning signal. may get a new high but if unconfirmed by RSI sell off should be imminent.

DOW INDUSTRIAL
struggling near 13,000 level. Rising wedge formation (bearish), 13,00o psychological round number, and break out there could see 13100/13200 quickly, before a significant reversal probably targeting 12500
Monday, February 20, 2012
Crude oil heading to 111 target
Crude oil still heading to 111 minimum target short term , and more likely higher medium term
CRUDE OIL weekly chart
AB leg followed by consolidation, classic BULL FLAG. Now broken up above the top of the flag, could get move to 129, which is where CD = AB leg up. Also coincides with 50% Fib retrace of fall from July 2008 highs.

CRUDE DAILY CHART
Daily looks like approaching overbought, so some sideways corrective action ahead.
BUY on weakness..

CRUDE 2 HR CHART

Friday, February 17, 2012
GBPUSD Cable revisited
CABLE WEEKLY CHART
Still in large triangle, tested the lower boundary and now rebounded. Also breaking a down trend from 1.67 high in August 2011, so LONGER TERM could be ready to head to the upper boundary at approx 1.65

CABLE DAILY CHART
On the daily also looks like the bear case has weakened, and if we break 1.5930 to the upside 1.65 could be possible. Some more consolidation may be needed before this, but it looks like BUY on weakness..rather than SELL on strength.


Still in large triangle, tested the lower boundary and now rebounded. Also breaking a down trend from 1.67 high in August 2011, so LONGER TERM could be ready to head to the upper boundary at approx 1.65

On the daily also looks like the bear case has weakened, and if we break 1.5930 to the upside 1.65 could be possible. Some more consolidation may be needed before this, but it looks like BUY on weakness..rather than SELL on strength.

4 HOUR CHART

FTSE close to break out ...again
FTSE 1 HOUR CHART
The hourly chart shows the uptrend perfectly.
Prices are "banging" on the resistance at 5920..
A clean break through here should accelerate the up move, possibly beginning the end of the move..
Looking for a relatively quick move to 6100, to take profits and possibly go SHORT
As always there is at LEAST 1 different scenario...
A break below the BLUE uptrend line..probably means a deeper correction sooner rather than later..

Thursday, February 16, 2012
Copper back to first support level
Copper still on target for higher levels form the triangle break out pattern.
Now retracing at first support 374/373 (previous high)
Possible to get move down as low as 365 (retest of the break out level)
Basically overbought indicators are now reset..
COPPER DAILY

Now retracing at first support 374/373 (previous high)
Possible to get move down as low as 365 (retest of the break out level)
Basically overbought indicators are now reset..
COPPER DAILY
Parabolic move AAPL similar to SILVER?
Well AAPL triggered a sell off yesterday rallying as high as 528 before selling off. It is in a parabolic move up, so looking at a chart of silver (which also had a parabolic move up in April 2011)
APPLE DAILY CHART


APPLE DAILY CHART

Now compare to SILVER daily

what happened next???
So the initial fall was 2 days, before it rallied to test the highs again and THEN collapsed. Everybody was very bullish on silver at the time. (similar to AAPL now).
So probably worth watching to see how it reacts, it may be just a correction, as PARABOLIC moves can and do go much further than people think they will.

Wednesday, February 15, 2012
FTSE and DAX LONG term charts (MONTHLY)
While markets are trading at or near recent highs worth taking a step back with a look at the bigger picture, IE MONTHLY charts.
We are not very far off the all time highs.
MACD in both cases looks to be turning up (lagging indicator)
RSI is NOT overbought
SO on a LONG term view these markets could be ready to challenge the ALL TIME HIGHS.
BUT shorter term probably due a correction on the DAILY charts (click here)
DAX MONTHLY

FTSE MONTHLY

DAX and FTSE daily
Both trading near resistance levels, and not giving much back so far, which suggests a move higher which could be fast, before a more sizeable correction.
FTSE could move to 6100, where there is RESISTANCE
DAX 6970
From those levels probability favours move down.
FTSE DAILY


FTSE could move to 6100, where there is RESISTANCE
DAX 6970
From those levels probability favours move down.
FTSE DAILY

DAX DAILY

Tuesday, February 14, 2012
EURO
Rally from 1.26 to 1.33 has stalled. Is that it?
Despite today's downgrades form Moody's the euro recovered after an initial sell off. making recent action more likely to be a CONSOLIDATION of the move up, rather than TOPPING.
Key level, 1.30 (a break below there would change scenario to bearish and at least a retest of the lows at 1.26)
Otherwise, above that level, suggests a continuation of the rally to min 1.35 and possible 1.40 as shown in the chart below. Sentiment is quick to turn bearish, and short positioning still relatively large.

Today
Bad news out of Europe and bears get sucked in again !
FTSE 30 minute chart
possible inverse head and shoulders neckline 5920 target 6000

NDX daily chart
The Nasdaq has been a leader in the equity rally.
Looking at past rallies on the daily chart we can see that we are either nearing a top (UNLIKELY) or (MORE LIKELY) a minor correction of 5-7 % before the rally continues up
Especially as we have come out of a LARGE consolidation lasting almost 8 months. A 5 % correction would retest the break out level.
Strategy: take profits on longs, wait correction for re-entry
Nimble : short on strength, for short term trade

FTSE 30 minute chart
possible inverse head and shoulders neckline 5920 target 6000

The Nasdaq has been a leader in the equity rally.
Looking at past rallies on the daily chart we can see that we are either nearing a top (UNLIKELY) or (MORE LIKELY) a minor correction of 5-7 % before the rally continues up
Especially as we have come out of a LARGE consolidation lasting almost 8 months. A 5 % correction would retest the break out level.
Strategy: take profits on longs, wait correction for re-entry
Nimble : short on strength, for short term trade

Monday, February 13, 2012
Copper and Crude
Copper has been leading the "RISK" rally since mid December, BUT now looks like a rest is needed with NEGATIVE DIVERGENCE shown on the chart, also coinciding with short term dollar strength...
Possible move to as low as 365, but 375 looks more likely before resumption of the trend UP, targeting 440/450 ..
COPPER DAILY


Possible move to as low as 365, but 375 looks more likely before resumption of the trend UP, targeting 440/450 ..
COPPER DAILY

CRUDE OIL also looks close to breaking our of recent consolidation and a move above 100/101 could start the next leg up there targeting 114 minimum..


Thursday, February 9, 2012
FTSE a look at the trend UP..different time frames
4 hour FTSE chart
We can see that since end of November the trend is UP..
and we are at a minor resistance near 5915 hence the market consolidating. We may get a push down to the trend line 5775, before pushing through.

The FTSE DAILY chart shows resistance more clearly


Having a quick look at the US market, specifically the S&P 500 index weekly

We can see we are approaching 1372 ..OBVIOUS RESISTANCE.
Scenario for the markets is:
S&P breaks 1370 level briefly and then falls back as investors perceive as a double top.
A quick correction short and sharp and then when the market doesn't fall as much as people expect , a longer rally through 1370 and as high as 1425/1450 as more "public" are lured onto the BUY side.
Obviously European markets will respond in a similar manner
We can see that since end of November the trend is UP..
and we are at a minor resistance near 5915 hence the market consolidating. We may get a push down to the trend line 5775, before pushing through.

The FTSE DAILY chart shows resistance more clearly

The push above should target 6100 minimum.
FTSE WEEKLY chart
Above 6100 we target the highs of the FTSE at 6830 !!

Having a quick look at the US market, specifically the S&P 500 index weekly

We can see we are approaching 1372 ..OBVIOUS RESISTANCE.
Scenario for the markets is:
S&P breaks 1370 level briefly and then falls back as investors perceive as a double top.
A quick correction short and sharp and then when the market doesn't fall as much as people expect , a longer rally through 1370 and as high as 1425/1450 as more "public" are lured onto the BUY side.
Obviously European markets will respond in a similar manner
Wednesday, February 8, 2012
Fake out to the downside Crude and Euro
Crude oil managed to spook yesterday with a nice fake out to the downside, and probably encouraged some short selling and/or triggered stop losses for longs...before reversing sharply higher...
30 min chart below..


30 min chart below..

So still in the potential BULL FLAG.. and now more likely to see a break above 101 (after a bit of time to digest yesterday's gains)
The daily chart shows the FLAG
MACD looks to turn up
Upside target if it breaks North could be as high as 121

The €/$ also did a similar move, not quite as dramatic but tested the 1.3030 level, before reversing sharply higher and breaking resistance at 1.3225
Same as for oil, expect some back filling but should head to 1.35 minimum, and after hearing CNBC commentators yesteray advising selling into strength this may go as high as 1,40!! (good contrarian indicator)

Tuesday, February 7, 2012
Crude oil..still consolidating or forming a top?
Crude oil still in a channel...trending lower, BUT is it a bull flag or topping?
Daily chart

Personally it looks like after the bottom formed in Oct 11, which showed bullish divergence between Price and RSI, we had a STRONG LEG up to the November high, and since then it looks like it is in consolidation for at LEAST one more leg higher.
A significant break of the December lows would change that
STRATEGY if bullish : buy on weakness, or wait for a break above 101
Weekly chart
RSI seems to have found support, only negative is MACD may be about to cross down, BUT lagging indicator and many time it approaches the signal and turns up.

Monday, February 6, 2012
EURUSD consolidating ready for break higher.
Or it could break lower..BUT EURO short position still large..
As seen in chart below .large speculators SHORT
Commercial ..LONG
usually commercials are right in medium term
European news is OLD HAT!!
Even Greece default will have short lived effect on the market, as it has been talked about for so long IMHO


As seen in chart below .large speculators SHORT
Commercial ..LONG
usually commercials are right in medium term
European news is OLD HAT!!
Even Greece default will have short lived effect on the market, as it has been talked about for so long IMHO

Euro daily chart

Looking at the 4hr chart below: we can see the consolidation pattern clearer. We may have a "fake out move" to the downside before the break out up. Maybe...

Friday, February 3, 2012
FTSE almost to 1st target
As pointed out in previous post chart here the FTSE has almost made it the 1st objective at 5915, though we may get a little pop higher to 5960.
Looking at the chart below we can see previous resistance at the 5916-5960 level so expecting some sort of correction from there.
If we burst through that then 6100 level comes into play. The April 2011 highs..


Looking at the chart below we can see previous resistance at the 5916-5960 level so expecting some sort of correction from there.
If we burst through that then 6100 level comes into play. The April 2011 highs..

Weekly chart shows resistance at 6100 level (rectangular area)

Subscribe to:
Posts (Atom)