Sentiment wise the bull rally has been dominant since late 2011, and sentiment seems that EVERYBODY is looking for a pull back to buy again, so my CONTRARIAN thinking cap says the pull back will be DEEPER than people expect to SCARE the BULLS....
after a drop of just over 1 % for the DOW, already seems like the BULLS are ALREADY sniffing at the LONG side...
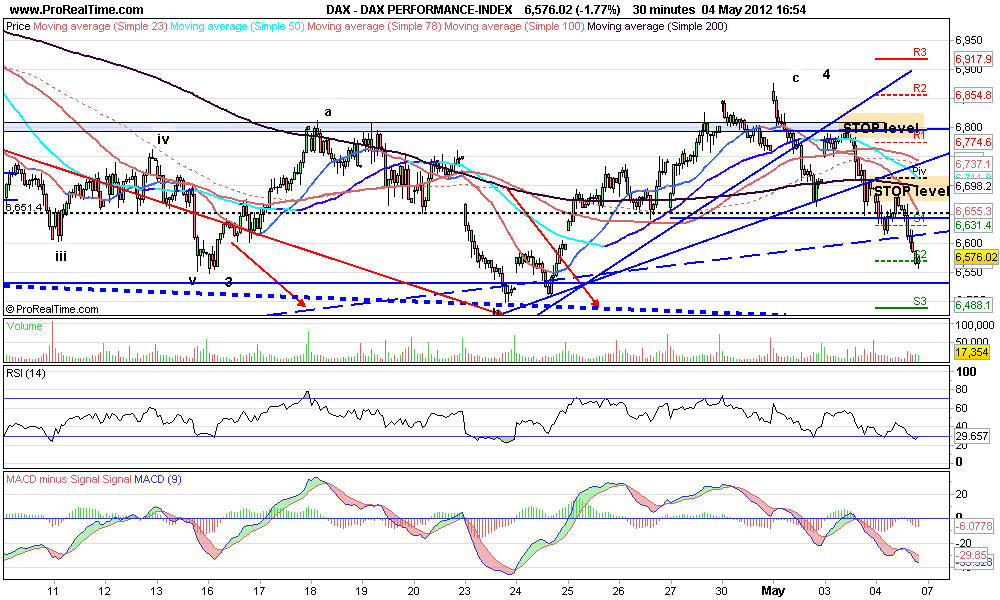
The FTSE and the DAX charts show the possibility of the SCARY fall which would then justify going LONG again in anticipation of new highs.
After a weak close Friday and possibly the start of short to medium term down trend a look at possible targets:
FTSE daily
Chart shows that 200 dma has been a key level for the last 2 years.
Friday's action looks like breaking the up trend in force since October 2011
First target 200 dma at 5562
If that fails or bounce is weak, FLAG target is 5390/5400
If it rallies strongly and breaks above flag top NEW HIGHS likely.
DAX daily.
2 bearish formations in play
A. Head and Shoulders
(NOT CONFIRMED) if breaks 6460 level then target is 5875
B. Flag (Confirmed) targets 6035


