It seems that buyers are stepping in on the falls and sellers are selling the rallies..
At some point one side will dominate...
at the moment based on charts - the bears have the upper hand..
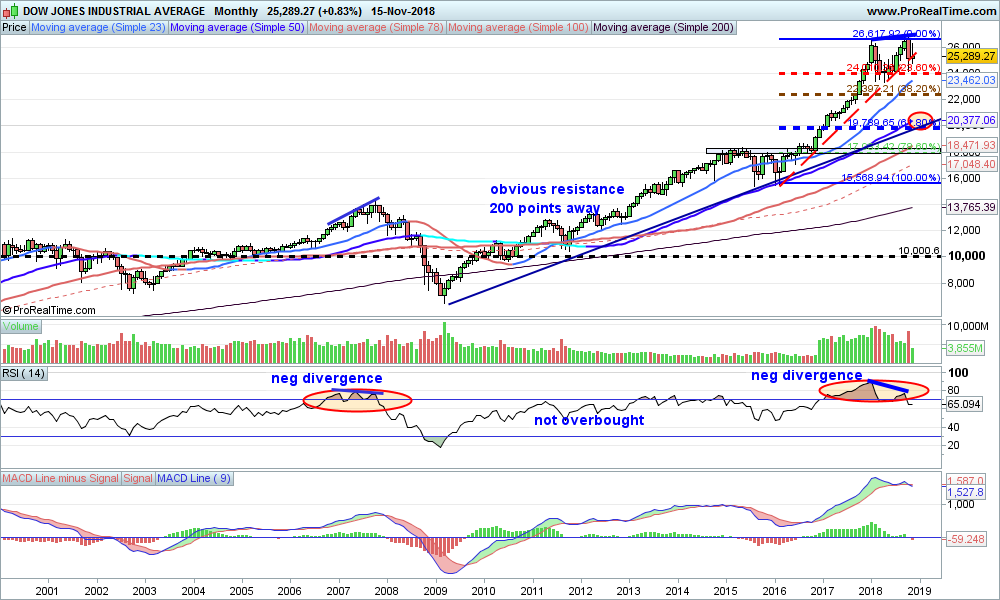
Monthly chart gives perspective...
It shows the extend of the rally.
At a minimum it should correct the rally from 2016, and looking at Fibonacci levels, 23.8 % would be around 24k.
38.2 % would be 22500, or thereabouts
61.8 % level is 19700 (BIG correction) - this level may tie in with a correction of the rally from 2008 i.e. a larger correction.
IF this is a correction of the rally from 2008 (about 7k to 27k) the corresponding fib levels would be:
23.8 % - c 22k
38.2 % 19k
61.8 % 14300 -
Notice that 61.8 % level of the smaller correction is similar to the 38.2 % level of the larger correction (KEEP 19k in mind)
ALSO notice the negative divergences between price and RSI which is a clue that a decline is on the cards
Zooming in to the weekly; shows key levels a bit clearer

Finally even shorter term , the DOW daily
This shows the battle between buyers and sellers at that trend line, with a break and then rally, and again another break.
The next post will be about the psychology of these breaks of trend, ANIMAL BEHAVIOUR - (or if you're precious about the human race , HUMAN behaviour)

No comments:
Post a Comment