


Weekly chart (middle) shows that price is approaching a support zone, previous support and resistance area around the 58 USD mark.
Not oversold yet on weekly.
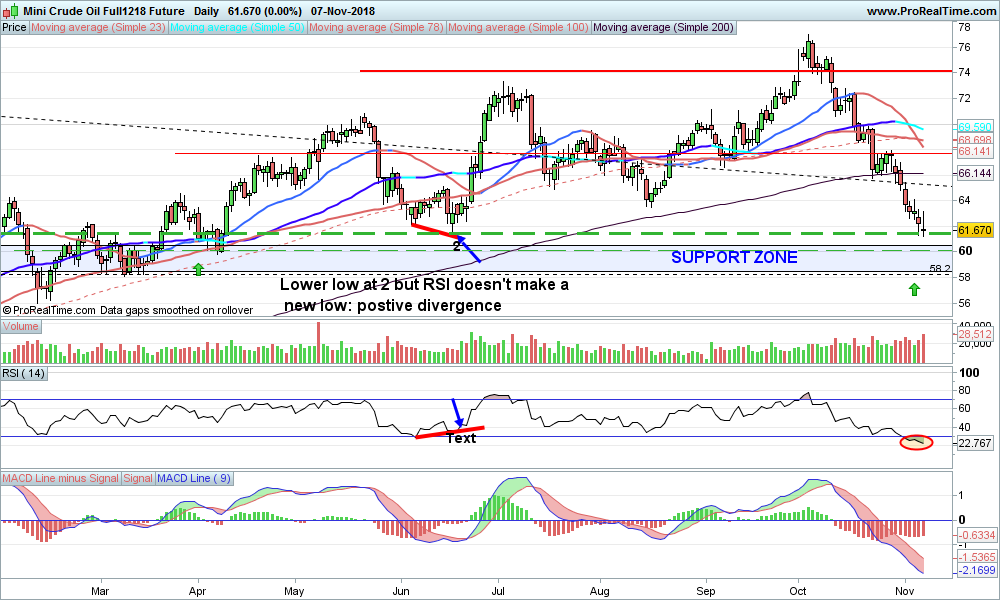
Daily chart: shows the support zone more clearly. Looking oversold but no divergence between RSI and price.
See below for an example of positive divergence between price and RSI
No comments:
Post a Comment