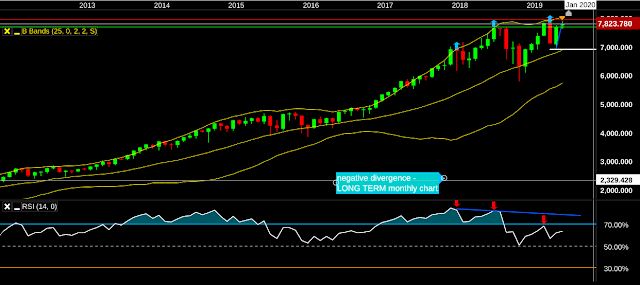
DAX - monthly
Again, as with the Nasdaq 100 the Dax long term chart is also showing NEGATIVE DIVERGENCE - as it's a LONG TERM chart - it's a warning signal not a call to action - but worth bearing in mind.
Where are we? over 10 years of a bull market -
Technical analysis of Major Markets, F/X, and anything that can be traded This is my diary for trading Views expressed in this are only for educational purposes. They ARE NOT recommendations to BUY or SELL anything!! ALL comments and criticisms welcome.
Quotes
Look back over the past, with its changing empires that rose and fell, and you can foresee the future too.
— Marcus Aurelius
Followers
Search This Blog
Monday, July 22, 2019
LONG TERM CHARTS 1
Nasdaq 100
DANGER - Will Robinson!!
Long term chart, but seems to suggest weakening market
New highs, but RSI is trending lower, negative divergence
Worth keeping an eye on it
DANGER - Will Robinson!!
Long term chart, but seems to suggest weakening market
New highs, but RSI is trending lower, negative divergence
Worth keeping an eye on it
Subscribe to:
Comments (Atom)

