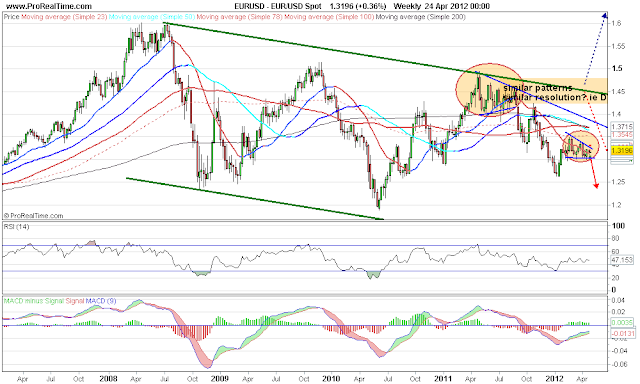
recent action shows similar pattern to that between April and August 2011. Will it resolve in same way? I.e. DOWN?
The daily chart shows what appears to be a TRIANGLE or Head and Shoulders formation
Upper boundary around 1.3270
Lower boundary 1.30 (neckline, base triangle)


No comments:
Post a Comment