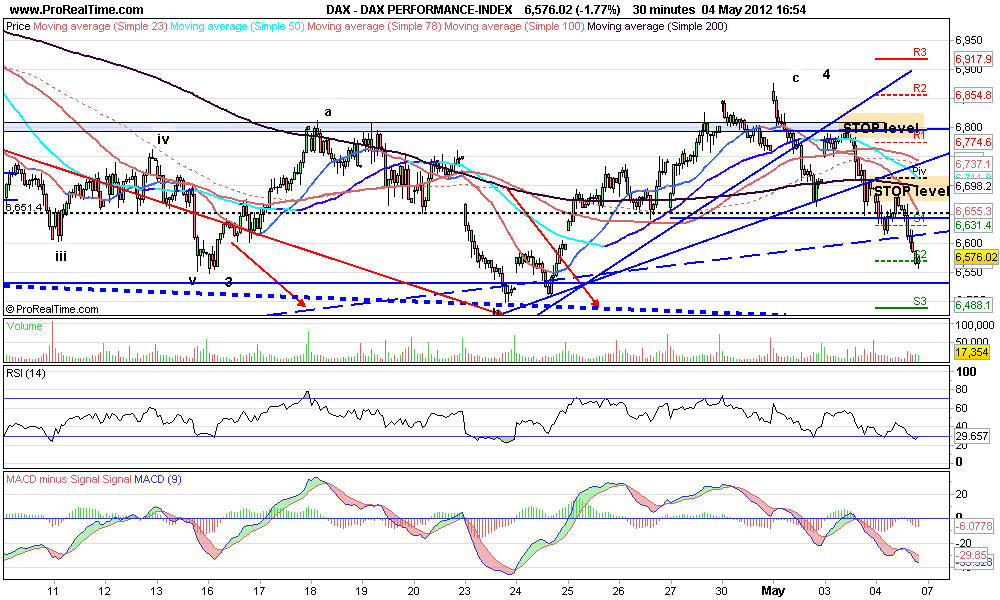
Yesterday's rally was a bear rally.
strong, low volume, and serves to:
a. stop out the shorts
b. suck in the longs.
DAX
recently has been holding up pretty well, but not out of the BEAR woods YET..
A test of the lows at 6225 and a hold could be a nice BUY (tight stop)
IF it breaks the lows then we could see a PANIC move down to 6k or 5870
Nimble trading necessary as if it approaches the lower levels would be good LONG opp
FTSE
Similar to the DAX but with a clearer down move from the highs
Blew past the FLAG target (interesting that yesterday's rally went TO THE FLAG target)
5260 recent low WATCH this level !!
below targets:
5180 is the H&S target
5020 is KEY support
and below 4850
Unlikely to get to the lowest target, and at 5180 flattening out the shorts!
Below that look for longs
Technical analysis of Major Markets, F/X, and anything that can be traded This is my diary for trading Views expressed in this are only for educational purposes. They ARE NOT recommendations to BUY or SELL anything!! ALL comments and criticisms welcome.
Quotes
Look back over the past, with its changing empires that rose and fell, and you can foresee the future too.
— Marcus Aurelius
Followers
Search This Blog
Wednesday, May 23, 2012
Friday, May 18, 2012
DAX
DAX still on a sell after breaking 6400...
If nimble can trade it from long side BUT TREND is DOWN...beware!
STOP for shorts 6450
Could rally to test 6400 again..(dependent on performance of US mkts)
DAX daily
If nimble can trade it from long side BUT TREND is DOWN...beware!
STOP for shorts 6450
Could rally to test 6400 again..(dependent on performance of US mkts)
DAX daily
DAX 30 mins
The trend is down , interesting that each retracement is testing the 61.8 % fib retrace
So has room to go to 6370 (if it carries on following the pattern)
Wednesday, May 16, 2012
LONG TERM
Sometimes it's good to "step back" and look at the LONGER term charts..MONTHLY.
All pretty self explanatory.
Breaking multi month up trends
In all 3 RSI has not reached the overbought levels seen in previous TOPS - more rally to come, or a sign that the rally is weaker then it looks?
DAX monthly
All pretty self explanatory.
Breaking multi month up trends
In all 3 RSI has not reached the overbought levels seen in previous TOPS - more rally to come, or a sign that the rally is weaker then it looks?
DAX monthly
DOW INDUSTRIAL MONTHLY
FTSE 100 MONTHLY
DAX finally breaks 6400
The DAX finally broke 6400 today..just need acceleration to the downside form here, though it is possible it may have a re-test of that level (Shake out)
If 6300 breaks, then looking at 6035 as possible target and extreme at 5875 as outlined in previous post here
GOLD at support
Sentiment seems very BEARISH for GOLD and GOLD stocks..
The best time to buy!
Gold the metal is approaching support as shown in the daily chart.
NEM Newmont mining weekly chart
Approaching 61.8 % Fib retrace
40 % down from it's high at 72
The best time to buy!
Gold the metal is approaching support as shown in the daily chart.
NEM Newmont mining weekly chart
Approaching 61.8 % Fib retrace
40 % down from it's high at 72
FTSE approaching flag target
The FTSE is approaching the flag target outlined here
Here is the updated DAILY CHART
If selling accelerates the Head and Shoulders target is more likely at 5200
And just in case if the selling is CRASH like 5000 will be key...
Here is the updated DAILY CHART
If selling accelerates the Head and Shoulders target is more likely at 5200
And just in case if the selling is CRASH like 5000 will be key...
Thursday, May 10, 2012
FTSE update
Targets for drop remain the same..as pointed out in this post
Looking at the 2 hr chart, can see that market is short term oversold..
Would look to sell in the "zone" (Area between previous support and resistance) 5573 to 5621
200 dma is at 5558 so may not get as high as the "zone"
FTSE 2 hr
FTSE DAILY
Looking at the 2 hr chart, can see that market is short term oversold..
Would look to sell in the "zone" (Area between previous support and resistance) 5573 to 5621
200 dma is at 5558 so may not get as high as the "zone"
FTSE 2 hr
FTSE DAILY
Wednesday, May 9, 2012
FTSE (and DAX)
So with recent market action, especially in the FTSE, my previous post "FTSE vs DAX conundrum" seems to have answered itself.
As wave 4's cannot enter wave 1 price action, then it looks like 5 waves completed up on 14th March and we are now in
Either
an A-B-C correction (currently in C down)
OR (more bearish)
a new move down and we are in a wave 3
IF ABC then once complete the BULL run should resume and we see new highs...
IF new move down, once 3 completes we should see a corrective move up then NEW LOWS.
FTSE DAILY CHART
As wave 4's cannot enter wave 1 price action, then it looks like 5 waves completed up on 14th March and we are now in
Either
an A-B-C correction (currently in C down)
OR (more bearish)
a new move down and we are in a wave 3
IF ABC then once complete the BULL run should resume and we see new highs...
IF new move down, once 3 completes we should see a corrective move up then NEW LOWS.
FTSE DAILY CHART
DAX DAILY
Euro decided?
Looks like the EURUSD has decided which way it's going and for NOW that seems to be down.
Broken support at 1.30/1.2960
Target 1.2510
Close stop @ 1.30 (tight) or 1.3055 (looser)
Daily chart (yesterday's close)
Broken support at 1.30/1.2960
Target 1.2510
Close stop @ 1.30 (tight) or 1.3055 (looser)
Daily chart (yesterday's close)
Tuesday, May 8, 2012
AUDUSD
Aussie dollar (v USD) broke the flag...and looks to be headed medium term to .9860..NOTHING goes DOWN (Or UP) in a straight line..sell strength take profits on the sharp dips...BE NIMBLE!!
DAX 3 hr
DAX plunged yesterday morning and rallied 20 points during the day..so was that it?
Using strength to sell into..still targeting min 6035 previous post here
The rally was at obvious support at 6400..
Using strength to sell into..still targeting min 6035 previous post here
The rally was at obvious support at 6400..
Saturday, May 5, 2012
Weekend work
Sentiment wise the bull rally has been dominant since late 2011, and sentiment seems that EVERYBODY is looking for a pull back to buy again, so my CONTRARIAN thinking cap says the pull back will be DEEPER than people expect to SCARE the BULLS....after a drop of just over 1 % for the DOW, already seems like the BULLS are ALREADY sniffing at the LONG side...
The FTSE and the DAX charts show the possibility of the SCARY fall which would then justify going LONG again in anticipation of new highs.
After a weak close Friday and possibly the start of short to medium term down trend a look at possible targets:
FTSE daily
Chart shows that 200 dma has been a key level for the last 2 years.
Friday's action looks like breaking the up trend in force since October 2011
First target 200 dma at 5562
If that fails or bounce is weak, FLAG target is 5390/5400
If it rallies strongly and breaks above flag top NEW HIGHS likely.
DAX daily.
2 bearish formations in play
A. Head and Shoulders (NOT CONFIRMED) if breaks 6460 level then target is 5875
B. Flag (Confirmed) targets 6035
The FTSE and the DAX charts show the possibility of the SCARY fall which would then justify going LONG again in anticipation of new highs.
After a weak close Friday and possibly the start of short to medium term down trend a look at possible targets:
FTSE daily
Chart shows that 200 dma has been a key level for the last 2 years.
Friday's action looks like breaking the up trend in force since October 2011
First target 200 dma at 5562
If that fails or bounce is weak, FLAG target is 5390/5400
If it rallies strongly and breaks above flag top NEW HIGHS likely.
DAX daily.
2 bearish formations in play
A. Head and Shoulders (NOT CONFIRMED) if breaks 6460 level then target is 5875
B. Flag (Confirmed) targets 6035
Labels:
bear,
DAX,
flags,
FTSE,
sentiment.
Friday, May 4, 2012
DAX end of week look
DAX weekly looks to be close to a critical level; 6470, a break below and the UPTREND will be broken. This could induce a short (in time) but sharp (in price) sell off which would
a. deflate the bullish sentiment
b. encourage the bearish sentiment.
Keep eye on sentiment , when the bearish side gets too noticeable, be ready to reverse and BUY!
eg 30 min chart
a. deflate the bullish sentiment
b. encourage the bearish sentiment.
Keep eye on sentiment , when the bearish side gets too noticeable, be ready to reverse and BUY!
For now sell rallies stop above 6785..or drill down to lower time frame for lower stop levels.
Wednesday, May 2, 2012
AUDUSD daily
After falling from 1.085, recent action looks like consolidation of the move down, or a BEAR FLAG
Possible targets for next leg down (IF bear flag is confirmed)
FTSE vs DAX connundrum
FTSE and DAX look similar but with important differences in terms of Elliott Wave labeling.
FTSE daily
Recent down move LOOKS like a wave 4, BUT according to EW rules wave 4's CANNOT violate Wave 1's price. So an alternative may be that the move up concluded at 5990 mid March , and now we are either in a Wave 1 down, wave 2 in progress (bull move complete), Wave A down and wave B in progress; which means a wave 3 down (strong) or a Wave C down (also strong).
The DAX is similar BUT the recent downward move has not violated Wave 1 so current move up could be start of Wave 5 up; Is the move up convincing enough?
So there are 3 scenarios.
1. Bull move from December complete, and now in down trend.
2. Bull move from December complete and now in correction ABC with C down wave to come
3. Correction from highs complete and NOW in a move to NEW HIGHS
FTSE daily
Recent down move LOOKS like a wave 4, BUT according to EW rules wave 4's CANNOT violate Wave 1's price. So an alternative may be that the move up concluded at 5990 mid March , and now we are either in a Wave 1 down, wave 2 in progress (bull move complete), Wave A down and wave B in progress; which means a wave 3 down (strong) or a Wave C down (also strong).
The DAX is similar BUT the recent downward move has not violated Wave 1 so current move up could be start of Wave 5 up; Is the move up convincing enough?
So there are 3 scenarios.
1. Bull move from December complete, and now in down trend.
2. Bull move from December complete and now in correction ABC with C down wave to come
3. Correction from highs complete and NOW in a move to NEW HIGHS
Wednesday, April 25, 2012
EURO
EURO weekly
recent action shows similar pattern to that between April and August 2011. Will it resolve in same way? I.e. DOWN?
The daily chart shows what appears to be a TRIANGLE or Head and Shoulders formation
Upper boundary around 1.3270
Lower boundary 1.30 (neckline, base triangle)
Monday, April 23, 2012
Dax daily
Well if the count is correct looks like we are close to finishing, but I would expect some sort of panic move down and recovery to signal the downside has ended.
The bullish scenario:
The 200 dma is at 6190
Or a sharp 100 point drop and recovery..the UP UP and AWAY
The bearish scenario..
The DAX has already topped @7180 in March and we are now in a wave 1 and a wave 2 (abc correction) will occur when this down move is finished.
EITHER way it looks like the next decent move will be up...
The only CAVEAT is that the DOW looks like it should have quite a bit more downside left..
The bullish scenario:
The 200 dma is at 6190
Or a sharp 100 point drop and recovery..the UP UP and AWAY
The bearish scenario..
The DAX has already topped @7180 in March and we are now in a wave 1 and a wave 2 (abc correction) will occur when this down move is finished.
EITHER way it looks like the next decent move will be up...
The only CAVEAT is that the DOW looks like it should have quite a bit more downside left..
Friday, April 20, 2012
Cable update low risk short level..
Cable daily
Now at top of the "megaphone" pattern, and also horizontal resistance. Good low risk short level.
Thursday, April 19, 2012
DAX 2 hr chart
DAX 2 hr chart showing bear flags, just breaking another one..start of move down in 5th wave to 6450?
Cable /EURGBP
Cable has been relatively strong recently both vs the € and the US$, why? Maybe with the continuing EURO area problems, and a perception that the UK has a more flexible economy and an independent Central Bank, there may be (ironically) a rush to "safety" !
Looking at the charts
Cable daily close up
Still trading within what looks like a BROADENING WEDGE or MEGAPHONE
Key level seems to be 1.61 (trading at 1.6060 at time of writing)
strong resistance just above between 1.61 and 1.62
CABLE daily
EURO/GBP
Hovering above key support , break through or rally?
Looking at the charts
Cable daily close up
Still trading within what looks like a BROADENING WEDGE or MEGAPHONE
Key level seems to be 1.61 (trading at 1.6060 at time of writing)
strong resistance just above between 1.61 and 1.62
CABLE daily
Big picture could still be a large Head and Shoulders formation, a break out above 1.61 probably invalidates this and resistance would then be at 1.65
EURO/GBP
Hovering above key support , break through or rally?
Tuesday, April 17, 2012
EURO support test and PASS!
The €/$ tested support at 1.30 yesterday and passed with "flying" colours...now it has to overcome the next test to the upside at around the 1.32 level...and then the declining trend line at 1.3370 for a real push higher towards 1.37/1.40
A failure here could see another push down, below 1.30 next stop 1.26
DAX 30 mins fractals
Looking at the DAX 30 mins chart
1st rectangle shows down move followed by retrace which recovered 78.6 % of down move (Fibonacci)
2nd rectangular area (so far has retraced 78.6 %) see if it holds..interesting to see if we get the extended move down afterwards towards 6480/6450 support as outlined in post yesterday
1st rectangle shows down move followed by retrace which recovered 78.6 % of down move (Fibonacci)
2nd rectangular area (so far has retraced 78.6 %) see if it holds..interesting to see if we get the extended move down afterwards towards 6480/6450 support as outlined in post yesterday
Monday, April 16, 2012
FTSE
So as expected the FTSE daily looks similar to the DAX, with one clear difference if we are looking at the Elliott wave labeling; Wave 4 on the FTSE seems to have broken into Wave 1 top. Reading EW theory it seems that wave 4 should not retrace to wave 1 (somebody please enlighten me!!) Link to Elliott Wave rules
So this means either
A. something else is going on (market may have completed the bull run and now on an extended down move)
or (more likely!!)
B. wave count is wrong!! (It does look good though!)
So this means either
A. something else is going on (market may have completed the bull run and now on an extended down move)
or (more likely!!)
B. wave count is wrong!! (It does look good though!)
DAX (Germany)
The DAX daily chart updated below, shows the market could still be in a WAVE 4, with the final wave 5 up to come. Where is it likely that wave 4 will end?
Well price action is nearing trendline support at 6490 (ish) which is also near top of wave 1 at 6430.
DAX 30 minutes
shows we could be finishing a wave 3 down with a 4 up and final 5 down to complete wave 4. This pattern could also tie in with a false break down in the EURO and Copper
US markets also seem to need a little more downside corrective action..
EURO daily
The €/$ (EURUSD) is hovering at support near 1.30, TRIANGLE or Head n shoulders?
Similar to COPPER chart in that we could see a false break lower, followed by a strong rally...
Or a move lower and test of the lows at 1.26
break though neckline or triangle lower boundary , target is 1.2550
Break through upper boundary triangle , target is 1.3790
Similar to COPPER chart in that we could see a false break lower, followed by a strong rally...
Or a move lower and test of the lows at 1.26
break though neckline or triangle lower boundary , target is 1.2550
Break through upper boundary triangle , target is 1.3790
Copper update
More weakness today and pushing through the upward trend line..now it could be a FALSE break. Wait for follow through to downside, or if it fails then chances increase that it's a false break and the triangle target at 440 remains
Wednesday, April 11, 2012
COPPER at key level
Copper is taking it's time to find a way to the target from the break out of the symmetrical triangle and after yesterday's fall is right at the rising trend line, which SHOULD be support..HOWEVER the picture is less clear now and a fall through here could see a significantly sharper fall.
Volume on yesterday's drop was high..and may have exhausted the drop..
Worth keeping eye on as Dr Copper usually is a good indicator of the world economy...
Tuesday, April 10, 2012
Spain in the spotlight!
Well it looks like Spain is now in the spotlight and probably worth looking at the stock market there.
One thing is clear is despite most world markets having a positive performance since November 2011, Spain's performance has been muted and in recent weeks has been clearly negative, and the market is now hovering above a key level at 7500.
A break below here could also have negative repercussions for other European indices, in particular Germany.
IBEX 35 Monthly chart
One thing is clear is despite most world markets having a positive performance since November 2011, Spain's performance has been muted and in recent weeks has been clearly negative, and the market is now hovering above a key level at 7500.
A break below here could also have negative repercussions for other European indices, in particular Germany.
IBEX 35 Monthly chart
IBEX weekly
Thursday, April 5, 2012
DAX filling GAP @ 6709/6680
Just for "laughs" here is a possible BEARISH count for the price action on the 3hr chart...
DAX 3hr
Sti
Wednesday, April 4, 2012
DAX hovering above short term support
Dax 3hr chart shows about to test 6840 level and a break through there targets 6709 (Gap Area). In the bigger picture this could still be a 4th wave with a 5th wave yet to come to test the highs or more likely NEW highs.
Wave 4 could go as low as 6475 level... (top of wave1)
Subscribe to:
Posts (Atom)