The move off the lows in December caught a lot off guard by the strength and relentlessness of the rally, me included.
So pretty much watching this the last couple of months.
Some interesting things to watch and to note now the rally seems to be lng in the tooth (FLW) - with the Nasdaq 29 % up from the lows in December.
Reasons: Fed has reversed course - after jaw-boning about raising rates this year - it looks like they have succumbed to the Trump "pressure".
The trade deal with China (though the reality is that it will only be a band aid on a BIGGER problem)
European Central bank also looks to be on course to keeping the easy money flowing.
BUT will it help? - Think Japan..
Interesting Europe has underperformed the US, Germany up only about 12 %
Nasdaq daily chart
Looks like a rising wedge , and a classic throwover
overbought (but can remain like that)
After such an extended move - the probabilities increase that the next multi-day (multi-week) move will be down.
BIG question : will it just correct this move up, and then rally to new highs?
OR will it be the start of the next down leg and break to new lows?
watch this space..
What about behaviour?
Well this rally has definitely got everyone talking about new highs and that the bull market is back. TV pundits declared that the bear market has finished.
So this is the longest bull market in history (2008) - is a three month bear market really it?
Are companies forecasts at the end of 2018 of slowing sales and difficult conditions , already improved? (FED EX)
If not then valuations especially in the US market look rich.
The market has been led higher by increasingly smaller group of stocks FAANG and Boeing, while banks are struggling
So the BEAR market scenario
In a bear market the classic scenario is a wave 2 rally that sucks in the crowd amid declarations that the initial fall is over and good times are back -
CHECK
Bear market rallies are violent and sharp - CHECK
What about the alternative scenario? BULLISH
The rally from December is a Wave 1
A wave 2 down will do the opposite of the bearish scenario i.e. suck in the bears and may look like the start of a new leg down..
BUT if bullish and wave count correct, the next move up would be a WAVE 3
which SHOULD take the market to new HIGHS.
other markets in the next post
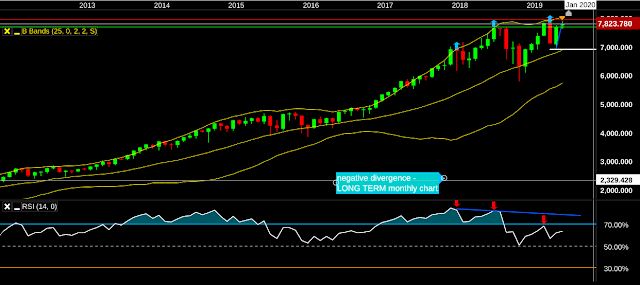
Nasdaq monthly chart - similarities with 1999/2000
March 2000 -May 2000 37 % fall
May to Sept 36 % rally
2018 -2019 fall of 25 % , followed by rally of 29%
Markets don't necessarily repeat themselves over time but they do rhyme
Human behaviour doesn't change - emotions are still the same


